Download
1 / 1
10 likes | 106 Vues
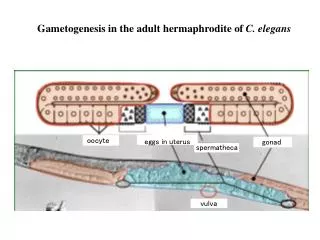
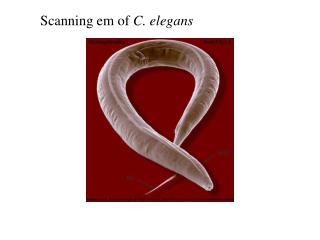
Optical Segmentation/ Object Detection. Worm Modeling. Bio-Med. Enviro-Civil. Worm template. Model Design. S2. S3. S4. S1. S5. Worm Detection/. L3. Constraints. Object validation. Segmentation. Modeling. Correspondence Analysis/. Track building. Validating TestBEDs. L2.

E N D
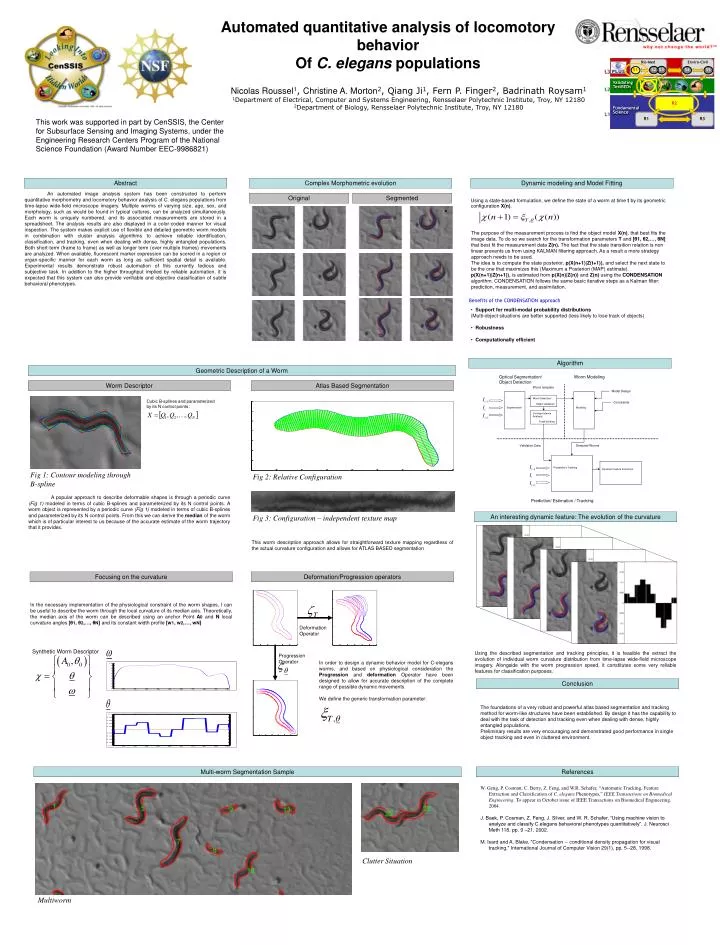
Optical Segmentation/ Object Detection Worm Modeling Bio-Med Enviro-Civil Worm template Model Design S2 S3 S4 S1 S5 Worm Detection/ L3 Constraints Object validation Segmentation Modeling Correspondence Analysis/ Track building ValidatingTestBEDs L2 Validation Data Detected Worms R2 Probabilistic Tracking Dynamic Feature Extraction FundamentalScience L1 R1 R3 Prediction/ Estimation / Tracking Complex Morphometric evolution An interesting dynamic feature: The evolution of the curvature Original Segmented Algorithm Fig 1: Contour modeling through B-spline Deformation Operator Progression Operator Automated quantitative analysis of locomotory behavior Of C. elegans populations Nicolas Roussel1, Christine A. Morton2, Qiang Ji1, Fern P. Finger2, Badrinath Roysam1 1Department of Electrical, Computer and Systems Engineering, Rensselaer Polytechnic Institute, Troy, NY 12180 2Department of Biology, Rensselaer Polytechnic Institute, Troy, NY 12180 This work was supported in part by CenSSIS, the Center for Subsurface Sensing and Imaging Systems, under the Engineering Research Centers Program of the National Science Foundation (Award Number EEC-9986821) Abstract Dynamic modeling and Model Fitting An automated image analysis system has been constructed to perform quantitative morphometry and locomotory behavior analysis of C. elegans populations from time-lapse wide-field microscope imagery. Multiple worms of varying size, age, sex, and morphology, such as would be found in typical cultures, can be analyzed simultaneously. Each worm is uniquely numbered, and its associated measurements are stored in a spreadsheet. The analysis results are also displayed in a color-coded manner for visual inspection. The system makes explicit use of flexible and detailed geometric worm models in combination with cluster analysis algorithms to achieve reliable identification, classification, and tracking, even when dealing with dense, highly entangled populations. Both short-term (frame to frame) as well as longer term (over multiple frames) movements are analyzed. When available, fluorescent marker expression can be scored in a region or organ-specific manner for each worm as long as sufficient spatial detail is available. Experimental results demonstrate robust automation of this currently tedious and subjective task. In addition to the higher throughput implied by reliable automation, it is expected that this system can also provide verifiable and objective classification of subtle behavioral phenotypes. Using a state-based formulation, we define the state of a worm at time t by its geometric configuration X(n). The purpose of the measurement process is find the object model X(n), that best fits the image data. To do so we search for the transformation parameters T and [θ1, θ2,…, θN] that best fit the measurement data Z(n). The fact that the state transition relation is non linear prevents us from using KALMAN filtering approach. As a result a more strategy approach needs to be used. The idea is to compute the state posterior, p(X(n+1)|Z(t+1)), and select the next state to be the one that maximizes this (Maximum a Posteriori (MAP) estimate). p(X(n+1)|Z(n+1)), is estimated from p(X(n)|Z(n)) and Z(n) using the CONDENSATION algorithm. CONDENSATION follows the same basic iterative steps as a Kalman filter: prediction, measurement, and assimilation. Benefits of the CONDENSATION approach • Support for multi-modal probability distributions • (Multi-object situations are better supported (less likely to lose track of objects) • Robustness • Computationally efficient Geometric Description of a Worm Worm Descriptor Atlas Based Segmentation Cubic B-splines and parameterized by its N control points: Fig 2: Relative Configuration A popular approach to describe deformable shapes is through a periodic curve (Fig 1)modeled in terms of cubic B-splines and parameterized by its N control points. A worm object is represented by a periodic curve (Fig 1)modeled in terms of cubic B-splines and parameterized by its N control points. From this we can derive the median of the worm which is of particular interest to us because of the accurate estimate of the worm trajectory that it provides. Fig 3: Configuration – independent texture map This worm description approach allows for straightforward texture mapping regardless of the actual curvature configuration and allows for ATLAS BASED segmentation Focusing on the curvature Deformation/Progression operators In the necessary implementation of the physiological constraint of the worm shapes, I can be useful to describe the worm through the local curvature of its median axis. Theoretically, the median axis of the worm can be described using an anchor Point A0 and N local curvature angles [θ1, θ2,…, θN] and its constant width profile [w1, w2,…, wN] Synthetic Worm Descriptor Using the described segmentation and tracking principles, it is feasible the extract the evolution of individual worm curvature distribution from time-lapse wide-field microscope imagery. Alongside with the worm progression speed, it constitutes some very reliable features for classification purposes. In order to design a dynamic behavior model for C-elegans worms, and based on physiological consideration the Progression and deformation Operator have been designed to allow for accurate description of the complete range of possible dynamic movements We define the generic transformation parameter: Conclusion The foundations of a very robust and powerful atlas based segmentation and tracking method for worm-like structures have been established. By design it has the capability to deal with the task of detection and tracking even when dealing with dense, highly entangled populations. Preliminary results are very encouraging and demonstrated good performance in single object tracking and even in cluttered environment. Multi-worm Segmentation Sample References W. Geng, P. Cosman, C. Berry, Z. Feng, and W.R. Schafer, “Automatic Tracking, Feature Extraction and Classification of C. elegans Phenotypes,” IEEE Transactions on Biomedical Engineering. To appear in October issue of IEEE Transactions on Biomedical Engineering, 2004. J. Baek, P. Cosman, Z. Feng, J. Silver, and W. R. Schafer, “Using machine vision to analyze and classify C.elegans behavioral phenotypes quantitatively”. J. Neurosci Meth 118, pp. 9 –21, 2002. M. Isard and A. Blake, "Condensation -- conditional density propagation for visual tracking," International Journal of Computer Vision 29(1), pp. 5--28, 1998. Clutter Situation Multiworm