Download
1 / 17
170 likes | 388 Vues
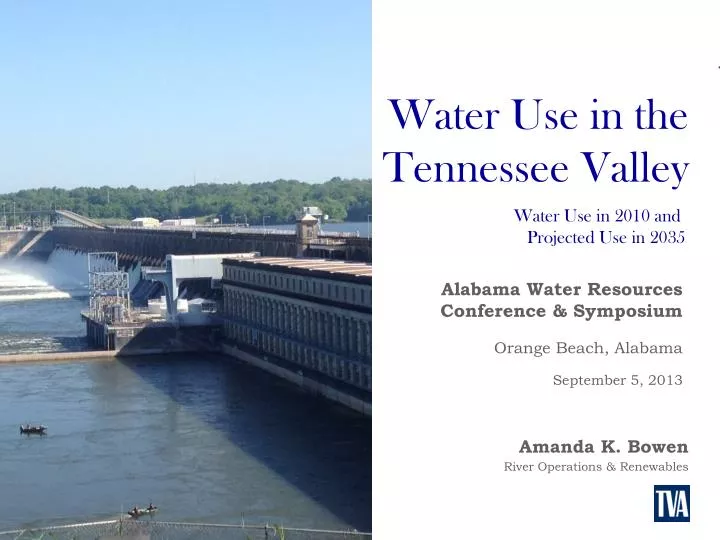
Water Use in the Tennessee Valley. Water Use in 2010 and Projected Use in 2035. Alabama Water Resources Conference & Symposium Orange Beach, Alabama September 5, 2013. Amanda K. Bowen. River Operations & Renewables. Presentation Topics. Why does TVA do a Water Use Report?

E N D
Water Use in the Tennessee Valley Water Use in 2010 and Projected Use in 2035 Alabama Water Resources Conference & Symposium Orange Beach, Alabama September 5, 2013 Amanda K. Bowen River Operations & Renewables
Presentation Topics • Why does TVA do a Water Use Report? • What are the results of the 2010 Study? • What are the results of the 2035 Projections?
Why the concern? “The principal water problem in the early twenty-first century will be one of inadequate and uncertain supplies…” —National Research Council Reference: National Research Council (2001)
Why the concern? • The quality of life in our region depends upon ample water for homes, businesses, farms, meeting places, and recreational activities • Dependable water is as fundamental to the economic growth of the region as is dependable, low-cost electricity • It is anticipated that water supply and water-quality issues, coupled with emerging water-use conflict over a fixed supply, will continue to increase across the southeast
Population Growth Rate 1990-2010 1990 Population 2010 Population Growth Rate (percentage) Georgia North Carolina Tennessee Virginia U.S. Average Alabama Kentucky Mississippi 6,478,149 6,632,448 4,877,203 6,189,197 248,790,925 4,040,389 3,686,892 2,575,475 9,687,653 9,535,483 6,346,105 8,001,024 308,745,538 4,779,736 4,339,367 2,967,297 50 44 30 29 24 18 18 15 Source: U.S. Census
The BIG Question Can the Tennessee River continue to meet the increasing water-supply demands throughout the watershed for the short- and long-term?
The Tennessee River System • 49 Dams for Integrated River Management • 29 Hydroelectric Dams • 19 Non-Power Dams • 1 Pumped-Storage Plant • 800 Miles of Navigable Waterway
The Tennessee River System in Alabama • 4 Non-Power Dams • Bear Creek • Upper Bear Creek • Little Bear Creek • Cedar Creek • 3 Hydroelectric Dams • Guntersville • Wheeler • Wilson • 6 Locks Serve ~60 Alabama Ports and Terminals • 3 Main Locks and 3 Auxiliary Locks (1 each at each dam) • 25 Municipalities and 11 Industries Withdrawal Water
Water Use Report Timeline 2000 2005 2010
Water Use in 2010 Reference: Bohac and Bowen (2012) All Units in mgd
2010 Water Use Return: 11,480 mgd (96.1% of WD) Consumptive Use: 471 mgd (3.9% of WD) Withdrawal: 11,951 mgd Reference: Bohac and Bowen (2012)
2010 Water Use in Alabama All units in MGD
Projected Water Use in 2035 *This is the projected information utilized in the Reservoir Operations Study using 2000 data. Reference: Bohac and Koroa (2004); Bohac and McCall (2008); Bohac and Bowen (2012)
References • Bohac, C. E. and Bowen, A. K., 2012, Water Use in the Tennessee Valley for 2010 and Projected Use in 2035, River Operations and Renewables, Tennessee Valley Authority, Chattanooga, Tennessee, July. • Bohac, C. E. and McCall, M. J., 2008, Water Use in the Tennessee Valley for 2005 and Projected Use in 2030, River Operations, Tennessee Valley Authority, Chattanooga, Tennessee, November. • Bohac, C. E., 2009. Water Supply and Demand in the Tennessee River Watershed, River Operations, Tennessee Valley Authority, Chattanooga, Tennessee, May • Bohac, C. E., and Koroa, M. C., 2004, Water Supply Inventory and Needs Analysis, River Operations, Tennessee Valley Authority, Chattanooga, Tennessee, November. • National Research Council, 2001, Envisioning the Agenda for Water Resources Research in the Twenty-First Century, Washington D.C.
Questions? For a copy of “Water Use in the Tennessee Valley for 2010 and Projected Use in 2035” please go to http://www.tva.com/river/watersupply/index.htm “When the well is dry, we’ll know the true worth of water.” – Benjamin Franklin