Download
1 / 1
10 likes | 193 Vues
Lag 3. Figure 8. Three month lag correlations between March snowcover days and June NAO 1949-2000. Data: 1 by 1 interpolated snowfall data (T. Mote, 2004) (Figure 1)

E N D
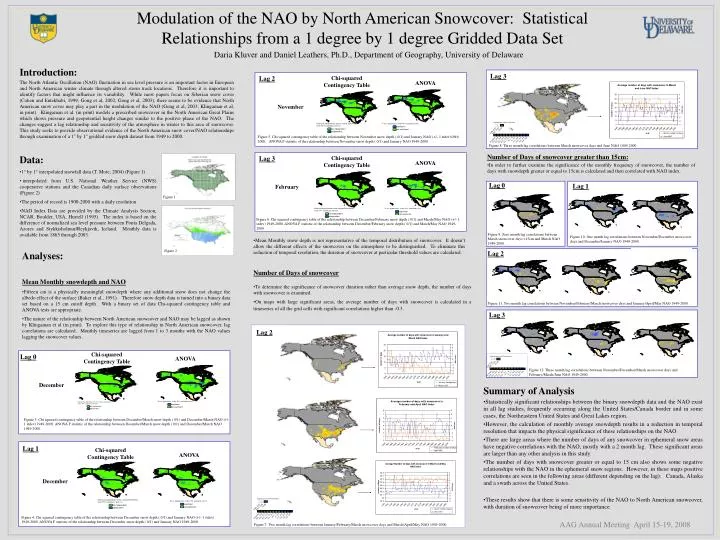
Lag 3 Figure 8. Three month lag correlations between March snowcover days and June NAO 1949-2000. • Data: • 1 by 1 interpolated snowfall data (T. Mote, 2004) (Figure 1) • interpolated from U.S. National Weather Service (NWS) cooperative stations and the Canadian daily surface observations (Figure 2) • The period of record is 1900-2000 with a daily resolution • NAO Index Data are provided by the Climate Analysis Section, NCAR, Boulder, USA, Hurrell (1995). The index is based on the difference of normalized sea level pressure between Ponta Delgada, Azores and Stykkisholmur/Reykjavik, Iceland. Monthly data is available from 1865 through 2003. Lag 0 Lag 1 Figure 1 Figure 9. Zero month lag correlations between March snowcover days >15cm and March NAO 1949-2000. Figure 10. One month lag correlations between November/December snowcover days and December/January NAO 1949-2000. Figure 2 Lag 3 Figure 12. Three month lag correlations between November/December/March snowcover days and February/March/June NAO 1949-2000. Significance and Correlation Significance and Correlation Significance and Correlation >0.05 >0.05 >0.05 0.00- 0.01 0.00- 0.01 0.00- 0.01 0.01 - 0.05 0.01 - 0.05 0.01 - 0.05 0 - 0.1 0 - 0.1 0 - 0.1 -0.1 - 0 -0.1 - 0 -0.1 - 0 0.1 - 0.2 0.1 - 0.2 0.1 - 0.2 0.2 - 0.3 0.2 - 0.3 0.2 - 0.3 0.3 - 0.4 0.3 - 0.4 0.3 - 0.4 0.4 - 0.5 0.4 - 0.5 0.4 - 0.5 no snow no snow no snow -0.6 - -0.5 -0.6 - -0.5 -0.6 - -0.5 -0.5 - -0.4 -0.5 - -0.4 -0.5 - -0.4 -0.4 - -0.3 -0.4 - -0.3 -0.4 - -0.3 -0.3 - -0.2 -0.3 - -0.2 -0.3 - -0.2 -0.2 - -0.1 -0.2 - -0.1 -0.2 - -0.1 Modulation of the NAO by North American Snowcover: Statistical Relationships from a 1 degree by 1 degree Gridded Data Set Daria Kluver and Daniel Leathers, Ph.D., Department of Geography, University of Delaware Introduction: The North Atlantic Oscillation (NAO) fluctuation in sea level pressure is an important factor in European and North American winter climate through altered storm track locations. Therefore it is important to identify factors that might influence its variability. While most papers focus on Siberian snow cover (Cohen and Entekhabi, 1999; Gong et al, 2002; Gong et al, 2003), there seems to be evidence that North American snow cover may play a part in the modulation of the NAO (Gong et al, 2003; Klingaman et al, in print). Klingaman et al. (in print) models a prescribed snowcover in the North American Great Plains which shows pressure and geopotential height changes similar to the positive phase of the NAO. The changes suggest a lag relationship and sensitivity of the atmosphere in winter to this area of snowcover. This study seeks to provide observational evidence of the North American snow cover/NAO relationships through examination of a 1° by 1° gridded snow depth dataset from 1949 to 2000. Lag 2 Chi-squared Contingency Table ANOVA November Figure 5. Chi squared contingency table of the relationship between November snow depth ( 0/1) and January NAO (+/- 1 stdev)1949-2000. ANOVA F statistic of the relationship between November snow depth ( 0/1) and January NAO 1949-2000. • Number of Days of snowcover greater than 15cm: • In order to further examine the significance of the monthly frequency of snowcover, the number of days with snowdepth greater or equal to 15cm is calculated and then correlated with NAO index. Lag 3 Chi-squared Contingency Table ANOVA February Figure 6. Chi squared contingency table of the relationship between December/February snow depth ( 0/1) and March/May NAO (+/- 1 stdev) 1949-2000. ANOVA F statistic of the relationship between December/February snow depth ( 0/1) and March/May NAO 1949-2000. • Mean Monthly snow depth is not representative of the temporal distribution of snowcover. It doesn’t allow the different effects of the snowcover on the atmosphere to be distinguished. To eliminate this reduction of temporal resolution, the duration of snowcover at particular threshold values are calculated. • Analyses: • Mean Monthly snowdepth and NAO • Fifteen cm is a physically meaningful snowdepth where any additional snow does not change the albedo effect of the surface (Baker et al., 1991). Therefore snow depth data is turned into a binary data set based on a 15 cm cutoff depth. With a binary set of data Chi-squared contingency table and ANOVA tests are appropriate. • The nature of the relationship between North American snowcover and NAO may be lagged as shown by Klingaman et al (in print). To explore this type of relationship in North American snowcover, lag correlations are calculated. Monthly timeseries are lagged from 1 to 3 months with the NAO values lagging the snowcover values. Lag 2 Number of Days of snowcover • To determine the significance of snowcover duration rather than average snow depth, the number of days with snowcover is examined. • On maps with large significant areas, the average number of days with snowcover is calculated in a timeseries of all the grid cells with significant correlations higher than -0.3. Figure 11. Two month lag correlations between November/February/March snowcover days and January/April/May NAO 1949-2000. Lag 2 Chi-squared Contingency Table Lag 0 ANOVA December • Summary of Analysis • Statistically significant relationships between the binary snowdepth data and the NAO exist in all lag studies, frequently occurring along the United States/Canada border and in some cases, the Northeastern United States and Great Lakes region. • However, the calculation of monthly average snowdepth results in a reduction in temporal resolution that impacts the physical significance of these relationships on the NAO. • There are large areas where the number of days of any snowcover in ephemeral snow areas have negative correlations with the NAO, mostly with a 2 month lag. These significant areas are larger than any other analysis in this study. • The number of days with snowcover greater or equal to 15 cm also shows some negative relationships with the NAO in the ephemeral snow regions. However, in these maps positive correlations are seen in the following areas (different depending on the lag): Canada, Alaska and a swath across the United States. • These results show that there is some sensitivity of the NAO to North American snowcover, with duration of snowcover being of more importance. Figure 3. Chi squared contingency table of the relationship between December/March snow depth ( 0/1) and December/March NAO (+/- 1 stdev) 1949-2000. ANOVA F statistic of the relationship between December/March snow depth ( 0/1) and December/March NAO 1949-2000. Lag 1 Chi-squared Contingency Table ANOVA December Figure 4. Chi squared contingency table of the relationship between December snow depth ( 0/1) and January NAO (+/- 1 stdev) 1949-2000. ANOVA F statistic of the relationship between December snow depth ( 0/1) and January NAO 1949-2000 AAG Annual Meeting April 15-19, 2008 Figure 7. Two month lag correlations between January/February/March snowcover days and March/April/May NAO 1949-2000.