Download
1 / 36
370 likes | 517 Vues
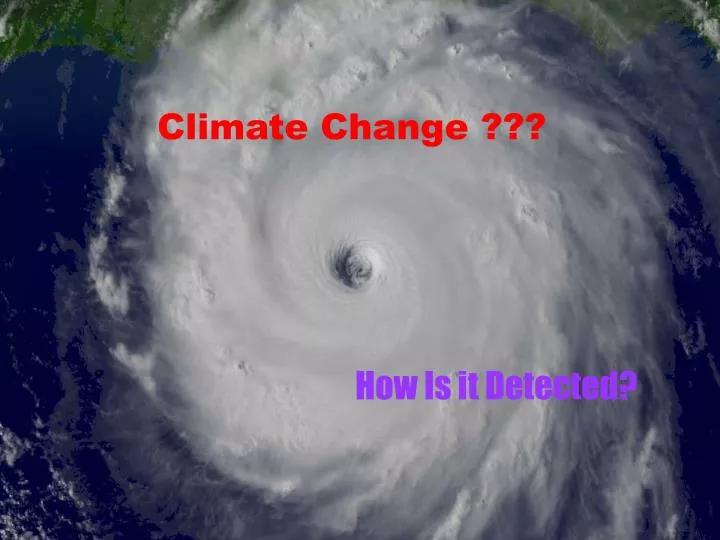
Climate Change ???. How Is it Detected?. Difficulties of Detecting Climate Change. Climate systems are intrinsically noisy The climate system is not well sampled Insufficient temporal baseline to determine proper amplitude of “natural” variations

E N D
Climate Change ??? How Is it Detected?
Difficultiesof Detecting Climate Change • Climate systems are intrinsically noisy • The climate system is not well sampled • Insufficient temporal baseline to determine proper amplitude of “natural” variations • Which recording sties are best tracers of climate change? • What indicators are best tracers of climate change?
Pacific Northwest Climate Change • Real or is it just our imagination? 1998 Official Climatology Statement It appears that Oregon is poised for a relatively warm, dry winter, after three years of cooler, wetter winters. That does not mean a return to drought conditions. In fact, the evidence suggests the PNW is in for a long period of cold and wet.
Reduced snow pack effects regional power generation; 2001 drought resulted in 46% price hike by BPA Reduced soil moisture in the Cascades elevates the risk of catastrophic forest fires CentralQuestion: Is the PNW getting warmer and drier?
Astrophysics and Climatology? • Digging signal out of noisy data constitutes most of observational astrophysics. Why not apply similar techniques (e.g. large scale smoothing, waveform analysis, etc) to climate data.
The PNW Climate Waveform? Y-axis is in units of standard deviation
PNI Questions: • Are the “features” significant? (remember Y-axis units are in standard deviations) • Is the PNI a fluke? • Is their bias due to incomplete sampling? • PNI and Fish Counts
Mid Century World Wide Cooling • May be reflected in the PNI?
Decadal Jet Stream Variations? • Physical Cause? • ENSO (El Nino) • PDO (Pacific Decadal Oscillilation) • NPI (North Pacific Index) • Other?
ENSO • Really has the wrong waveform • Amplitude variations occur on more rapid timescales (3-5 years)
PDO • First Discovered in 1996 • 6-18 month persistence of temperature anomalies • Unknown cause
NPI • Area weighted sea level pressure over the Gulf of Alaska
The basic issue is whether or not the cyclical behavior seen in the last century will continue into this one. We will show later that the PNI shows no sign of returning to the cool/wet cycle, even though its statistical time has arrived to do so.
Testing the Robustness of the PNI • Can the PNI be broadly reproduced by randomly selecting sites? • Does the PNI have a primary driver – rain, snow, temperature? • If the PNI can be reproduced (and is therefore not a fluke of these 3 sites) can we fit the time series to make a prediction about future climate?
On Robustness • Several thousand trials were run to randomly select sites and construct individual site specific indices to compare against the original PNI. • In all cases one can recover the basic PNI waveform, although there are amplitude differences • Conclude that the PNI waveform is real and does represent climate West of the Cascades
Rain, Temp or Snow? Temp shows most variation; followed closely by snow; Cool/wet periods are best defined by temp + snow;
Reconstructing the Time Series Fundamental Period = 53 years
3 component Fit In 1998, we should have started back into the cold and wet cycle
Eugene Rainfall 1960-1998 50.1 (mean) 9.4 (sd) 1.3 (m.e.) Eugene Rainfall 1999-2004 36.7 5.6 2.5 Recent Data inconsistent with return to cool/wet cycle Z-statistic is 4.8 (1 in 1,000,000 change of being random) 2001 Annual rain lowest in last 60 years 2005 Rain to date lower than 2001
Local Manifestation of Reduced Snow Pack http://climate.ntsg.umt.edu/html/science_western_water.pdf
Conclusions: • The PNI is robust and recoverable from analysis of many random sites • PNI amplitude is exaggerated by use of March 15 snowfall instead of annual snowfall • Statistical pattern suggests we should now be in the middle of a cool/wet cycle; empirical data (still limited of course) argues otherwise
Human Implications of This Climate Change • Decreased power production from hydroelectric dams due to lower snow packs. RATES will rise. • Don’t own a ski resort • Longer and likely more severe forest fire seasons • Continued milder winters might produce less weather related accidents