Download

1 / 38
390 likes | 544 Vues
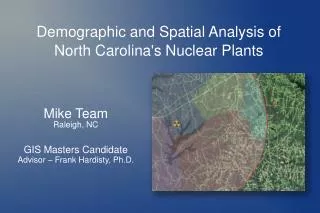
Mike Team Raleigh, NC GIS Masters Degree Student Advisor – Frank Hardisty, Ph.D. Demographic and Spatial Analysis of North Carolina's Nuclear Plants. Overview. Background and study goals Demographic Analysis Spatial Analysis methods and results Cost benefit/risk analysis

E N D
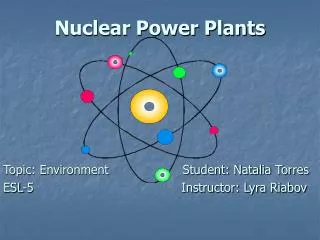
Mike Team Raleigh, NC GIS Masters Degree Student Advisor – Frank Hardisty, Ph.D. Demographic and Spatial Analysis of North Carolina's Nuclear Plants
Overview • Background and study goals • Demographic Analysis • Spatial Analysis methods and results • Cost benefit/risk analysis Show this list along with another image – more GIS mappy, possibly split page
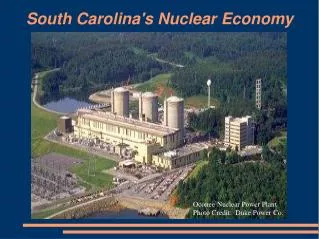
North Carolina Reactors • McGuire • 17 miles NW of Charlotte • Highest capacity in NC
North Carolina Reactors • Shearon Harris • 20 miles SW of Raleigh
North Carolina Reactors • Brunswick • 18 miles S of Wilmington • Lowest capacity in NC
Emergency Planning Zones • 10 Mile EPZ • Plume Exposure Pathway • 10 mile radius • Basic emergency planning area
Emergency Planning Zones • 50 Mile EPZ • Ingestion Exposure Pathway • 50 mile radius • Possible contamination of food and water
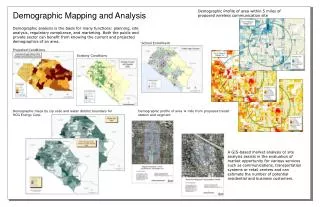
Population Data Sets • US Census – 2000 • Best 'count' of US Population • Available free to the public • 9 year old data set
Population Data Sets • Estimated Population Data – 2008 • Estimate of US Population - based on 2000 census • US Gov't provides estimates to county level • Private data available for a fee
Population Data Sets • LandScan Ambient Data – 2008 • Compiled by Oak Ridge (TN) National Labs • Raster data - 30“ x 30“ (~½ mile cell size) • Free with approved registration
Demographics (possible scrap this slide) • 2008 vs 2000
Reception Center Allocation • Straight Line Distance • "As the Crow Flies" - Euclidean distance • Does not consider any surface features
Reception Center Allocation • Straight Line Distance • Show SLD allocation results
Reception Center Allocation • Cost Weighted Distance • Raster calculation • Calculates best path based on 'travel cost' • Weights assigned subjectively
Reception Center Allocation • Cost Weighted Distance • Show roads layers with interstates and Rcs • Show Road thickness determined by cost
Reception Center Allocation • Cost Weighted Distance • Show CWD results
Reception Center Allocation • Allocation Comparison • Show harris' allocation map
Reception Center Allocation • Allocation Comparison • Show harris' allocation map
Reception Center Allocation • Allocation of Citizens • Show my allocation map including population #s
Reception Center Allocation • Allocation of Citizens • Show my allocation map including population #s
Reception Center Allocation • Allocation of Citizens • Show my allocation map including population #s
Population Analysis • What about the wind? • Show my allocation map including population #s
Cost Benefit Analysis • Comparing Population with Energy Output • Show my allocation map including population #s
Cost Benefit Analysis • Comparing Population with Energy Output • Show my allocation map including population #s
Conclusion • Show my allocation map including population #s