Download
1 / 25
250 likes | 353 Vues
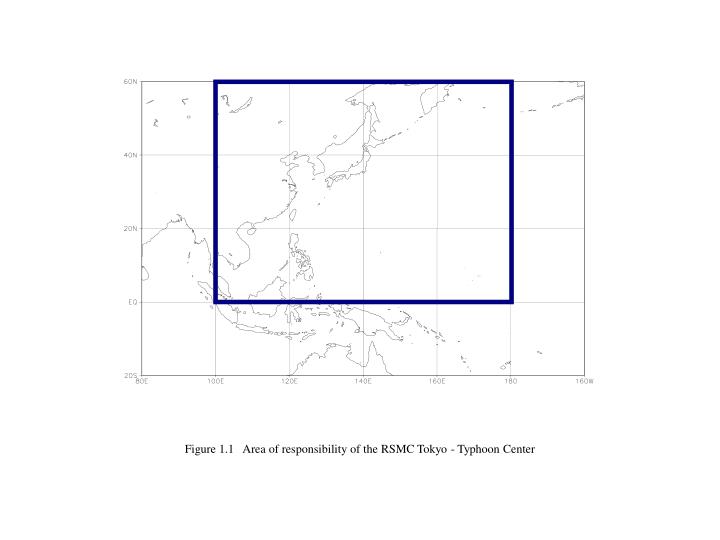
Figure 1.1 Area of responsibility of the RSMC Tokyo - Typhoon Center. Figure 3.1 Monthly mean streamline at 850 hPa (lines with arrows) and areas of less than 230 w/m2 of OLR (shaded) in September 2011. The tracks of the seven named TCs formed in September are superimposed onto the figure.

E N D
Figure 1.1 Area of responsibility of the RSMC Tokyo - Typhoon Center
Figure 3.1 Monthly mean streamline at 850 hPa (lines with arrows) and areas of less than 230 w/m2 of OLR (shaded) in September 2011. The tracks of the seven named TCs formed in September are superimposed onto the figure.
Figure 3.2 Monthly formations of TCs in 2011 compared to the 30-year average (1981-2010)
Figure 3.3 Tracks of the 21 named TCs in 2011. TC tracks for the period of TS or higher are shown.
Figure 3.4 Genesis points of the 21 TCs generated in 2011 (dots) and frequency distribution of genesis points for 1951 - 2010 (lines)
Figure 4.1 Annual means of position errors of 24-, 48-, 72-, 96- and 120-hour operational track forecasts
Figure 4.2.1 Histogram of position errors for 24-hour operational track forecasts in 2011
Figure 4.2.2 Histogram of position errors for 48-hour operational track forecasts in 2011
Figure 4.2.3 Histogram of position errors for 72-hour operational track forecasts in 2011
Figure 4.2.4 Histogram of position errors for 96-hour operational track forecasts in 2011
Figure 4.2.5 Histogram of position errors for 120-hour operational track forecasts in 2011
Figure 4.2.6 Histogram of position errors for 24-, 48-, 72-, 96-, 120-hour operational track forecasts in 2011
Figure 4.3.1 Histogram of central pressure errors for 24-hour forecasts in 2011
Figure 4.3.2 Histogram of central pressure errors for 48-hour forecasts in 2011
Figure 4.3.3 Histogram of central pressure errors for 72-hour forecasts in 2011
Figure 4.3.4 Histogram of central pressure errors for 24-, 48-, 72-hour forecasts in 2011
Figure 4.3.5 Histogram of maximum wind speed errors for 24-hour forecasts in 2011
Figure 4.3.6 Histogram of maximum wind speed errors for 48-hour forecasts in 2011
Figure 4.3.7 Histogram of maximum wind speed errors for 72-hour forecasts in 2011
Figure 4.3.8 Histogram of maximum wind speed errors for 24-, 48-, 72-hour forecasts in 2011
Figure 4.4 GSM annual mean position errors from 1997 to 2011
Figure 4.5.1 Error distribution of GSM position predictions of the tropical cycolones in 2011
Figure 4.5.2 Error distribution of GSM 30-hour intensity predictions of the tropical cyclones in 2011
Figure 4.5.3 Error distribution of GSM 54-hour intensity predictions of the tropical cyclones in 2011
Figure 4.5.4 Error distribution of GSM 78-hour intensity predictions of the tropical cyclones in 2011