Download
1 / 1
10 likes | 123 Vues
Methodology & Data. SAM. TES. OMI-MLS. JAN. APR. AUG. NOV. Tropical Tropospheric Ozone Analyses Measured from TOMS and AURA. M.J. Newchurch 1 , Jae H. Kim 1,2 , Somyoung Kim 2 , Ming Luo 3 , R. Martin 4 , and B. Sauvage 4 .

E N D
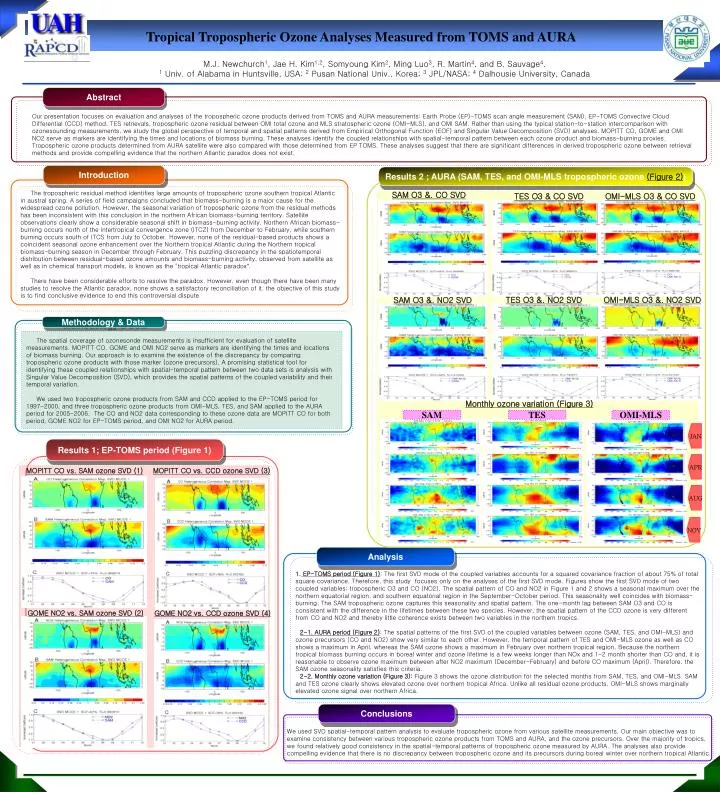
Methodology & Data SAM TES OMI-MLS JAN APR AUG NOV Tropical Tropospheric Ozone Analyses Measured from TOMS and AURA M.J. Newchurch1, Jae H. Kim1,2, Somyoung Kim2, Ming Luo3, R. Martin4, and B. Sauvage4. 1 Univ. of Alabama in Huntsville, USA; 2 Pusan National Univ., Korea; 3 JPL/NASA; 4 Dalhousie University, Canada Abstract Our presentation focuses on evaluation and analyses of the tropospheric ozone products derived from TOMS and AURA measurements: Earth Probe (EP)-TOMS scan angle measurement (SAM), EP-TOMS Convective Cloud Differential (CCD) method, TES retrievals, tropospheric ozone residual between OMI total ozone and MLS stratospheric ozone (OMI-MLS), and OMI SAM. Rather than using the typical station-to-station intercomparison with ozonesounding measurements, we study the global perspective of temporal and spatial patterns derived from Empirical Orthogonal Function (EOF) and Singular Value Decomposition (SVD) analyses. MOPITT CO, GOME and OMI NO2 serve as markers are identifying the times and locations of biomass burning. These analyses identify the coupled relationships with spatial-temporal pattern between each ozone product and biomass-burning proxies. Tropospheric ozone products determined from AURA satellite were also compared with those determined from EP TOMS. These analyses suggest that there are significant differences in derived tropospheric ozone between retrieval methods and provide compelling evidence that the northern Atlantic paradox does not exist. Introduction Results 2 ; AURA (SAM, TES, and OMI-MLS tropospheric ozone (Figure 2)) The tropospheric residual method identifies large amounts of tropospheric ozone southern tropical Atlantic in austral spring. A series of field campaigns concluded that biomass-burning is a major cause for the widespread ozone pollution. However, the seasonal variation of tropospheric ozone from the residual methods has been inconsistent with this conclusion in the northern African biomass-burning territory. Satellite observations clearly show a considerable seasonal shift in biomass-burning activity. Northern African biomass-burning occurs north of the intertropical convergence zone (ITCZ) from December to February, while southern burning occurs south of ITCS from July to October. However, none of the residual-based products shows a coincident seasonal ozone enhancement over the Northern tropical Atlantic during the Northern tropical biomass-burning season in December through February. This puzzling discrepancy in the spatiotemporal distribution between residual-based ozone amounts and biomass-burning activity, observed from satellite as well as in chemical transport models, is known as the "tropical Atlantic paradox“. There have been considerable efforts to resolve the paradox. However, even though there have been many studies to resolve the Atlantic paradox, none shows a satisfactory reconciliation of it. the objective of this study is to find conclusive evidence to end this controversial dispute SAM O3 &. CO SVD TES O3 & CO SVD OMI-MLS O3 & CO SVD TES O3 &. NO2 SVD OMI-MLS O3 &. NO2 SVD SAM O3 &. NO2 SVD The spatial coverage of ozonesonde measurements is insufficient for evaluation of satellite measurements. MOPITT CO, GOME and OMI NO2 serve as markers are identifying the times and locations of biomass burning. Our approach is to examine the existence of the discrepancy by comparing tropospheric ozone products with those marker (ozone precursors). A promising statistical tool for identifying these coupled relationships with spatial-temporal pattern between two data sets is analysis with Singular Value Decomposition (SVD), which provides the spatial patterns of the coupled variability and their temporal variation. We used two tropospheric ozone products from SAM and CCD applied to the EP-TOMS period for 1997-2000, and three tropospheric ozone products from OMI-MLS, TES, and SAM applied to the AURA period for 2005-2006. The CO and NO2 data corresponding to these ozone data are MOPITT CO for both period, GOME NO2 for EP-TOMS period, and OMI NO2 for AURA period. Monthly ozone variation (Figure 3) Results 1; EP-TOMS period (Figure 1) MOPITT CO vs. SAM ozone SVD (1) MOPITT CO vs. CCD ozone SVD (3) Analysis • EP-TOMS period (Figure 1): The first SVD mode of the coupled variables accounts for a squared covariance fraction of about 75% of total square covariance. Therefore, this study focuses only on the analyses of the first SVD mode. Figures show the first SVD mode of two coupled variables; tropospheric O3 and CO (NO2). The spatial pattern of CO and NO2 in Figure 1 and 2 shows a seasonal maximum over the northern equatorial region, and southern equatorial region in the September-October period. This seasonality well coincides with biomass-burning. The SAM tropospheric ozone captures this seasonality and spatial pattern. The one-month lag between SAM O3 and CO is consistent with the difference in the lifetimes between these two species. However, the spatial pattern of the CCD ozone is very different from CO and NO2 and thereby little coherence exists between two variables in the northern tropics. • 2-1. AURA period (Figure 2): The spatial patterns of the first SVD of the coupled variables between ozone (SAM, TES, and OMI-MLS) and ozone precursors (CO and NO2) show very similar to each other. However, the temporal pattern of TES and OMI-MLS ozone as well as CO shows a maximum in April, whereas the SAM ozone shows a maximum in February over northern tropical region. Because the northern tropical biomass burning occurs in boreal winter and ozone lifetime is a few weeks longer than NOx and 1-2 month shorter than CO and, it is reasonable to observe ozone maximum between after NO2 maximum (December-February) and before CO maximum (April). Therefore, the SAM ozone seasonality satisfies this criteria. • 2-2. Monthly ozone variation (Figure 3): Figure 3 shows the ozone distribution for the selected months from SAM, TES, and OMI-MLS. SAM and TES ozone clearly shows elevated ozone over northern tropical Africa. Unlike all residual ozone products, OMI-MLS shows marginally elevated ozone signal over northern Africa. GOME NO2 vs. SAM ozone SVD (2) GOME NO2 vs. CCD ozone SVD (4) Conclusions We used SVD spatial-temporal pattern analysis to evaluate tropospheric ozone from various satellite measurements. Our main objective was to examine consistency between various tropospheric ozone products from TOMS and AURA, and the ozone precursors. Over the majority of tropics, we found relatively good consistency in the spatial-temporal patterns of tropospheric ozone measured by AURA. The analyses also provide compelling evidence that there is no discrepancy between tropospheric ozone and its precursors during boreal winter over northern tropical Atlantic.