Download
1 / 12
120 likes | 274 Vues
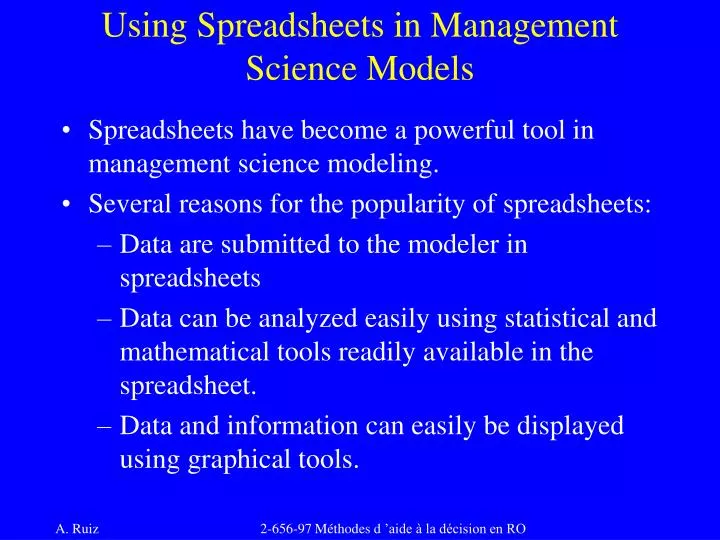
Using Spreadsheets in Management Science Models. Spreadsheets have become a powerful tool in management science modeling. Several reasons for the popularity of spreadsheets: Data are submitted to the modeler in spreadsheets

E N D
Using Spreadsheets in Management Science Models • Spreadsheets have become a powerful tool in management science modeling. • Several reasons for the popularity of spreadsheets: • Data are submitted to the modeler in spreadsheets • Data can be analyzed easily using statistical and mathematical tools readily available in the spreadsheet. • Data and information can easily be displayed using graphical tools. 2-656-97 Méthodes d ’aide à la décision en RO
Basic Excel functions and operators • Arithmetic Operations • Addition of cells A1and B1: • Subtracting cell B1 from A1: • Multiplication of cell A1 by B1: • Division of cell A1 by B1: • Cell A1 raised to the power in cell B1: = A1 + B1 = A1 - B1 = A1 * B1 = A1 / B1 = A1^ B1 2-656-97 Méthodes d ’aide à la décision en RO
Basic Excel functions and operators • Relative and absolute addresses • All row and column references are considered relative unless preceded by a “$” sign • When copied, ‘relative addresses’ change relative to the original cell position.Example: Cell E5 =A1+B$3+$C4+$D$6 = C5+D$3+$C8+$D$6 Cell G9 2-656-97 Méthodes d ’aide à la décision en RO
Basic Excel functions and operators • The F4 key • Pressing F4 will automatically put a $ sign in highlighted portions of formulas. • Press the F4 key once: The sign “$” appears in front of all rows and columns of the highlighted area of the formula. • Press the F4 key twice: The “$” sign appears in front of only the row references of the highlighted area of the formula. • Press the F4 key third time: The “$” sign appears in front of only the column references of the highlighted area of the formula. • Press the F4 key forth time: All the “$” signs are eliminated. 2-656-97 Méthodes d ’aide à la décision en RO
Basic Excel functions and operators • Arithmetic functions • Sum =SUM(A1:A3) • Returns the sum A1+A2+A3 • Average =Average(A1:A3) • Returns the arithmetic average of cells A1, A2, A3 • SUMPRODUCT =SUMPRODUCT(A1:A3,B1:B3) • Returns the sum of products A1·B1+A2·B2+A3·B3 • ABS =ABS(A3) • Returns the absolute value of the entry in cell A3. 2-656-97 Méthodes d ’aide à la décision en RO
Basic Excel functions and operators • Arithmetic functions – continued • SQRT =SQRT(A3) • Returns ÖA3 • MAX =MAX(A1:A9) • Returns the Maximum of the entries in cells A1 through A9. • MIN =MIN(A1:A9) • Returns the Minimum of the entries in cells A1 through A9. 2-656-97 Méthodes d ’aide à la décision en RO
Basic Excel functions and operators • Statistical functions • RAND() =RAND() • Generate a random number between 0 and 1 from a uniform distribution. • Probabilities and variable values under the normal distribution • NORMDISTNORMINV=NORMDIST(25,20,3,TRUE)=NORMINV(.55,20,3)Returns P(X<25) when m = 20 Returns x0,, such that P(X<x0)=.55 and s = 3 when m = 20 and s = 3 • NORMSDISTNORMSMINV=NORMSDIST(1.78)=NORMSINV(.55)Returns P(Z<1.78) Returns z0, such that P(Z<z0)=.55 2-656-97 Méthodes d ’aide à la décision en RO
Basic Excel functions and operators • Statistical functions • Probabilities and variable values under the t- distribution • TDISTTINV=TDIST(1.5,12,1)=TINV(.05,15)Returns P(t>1.5) Returns t0,, such that when n=12 P(t<-t0)=.025 and P(t>t0)=.025 when n=15.Note:=TDIST(1.5,12,2) returns P(t<-1.5) + P(t>1.5) when n=12. 2-656-97 Méthodes d ’aide à la décision en RO
Basic Excel functions and operators • Statistical functions – Other probability distributions • Poisson =POISSON(7,5,TRUE) • Returns P(X<7) for Poisson with l = 5.Note: false returns the probability density P(X = 7) • EXPONDIST =EXPONDIST(40,1/20,TRUE) • Returns P(X<40) for the exponential distribution with 1/m=20Note: false returns the probability density f(40)=20exp(-20(40)) 2-656-97 Méthodes d ’aide à la décision en RO
Basic Excel functions and operators • Conditional functions: • IF =IF(A4>4,B1+B2, B1 – B2) • Returns B1+B2 if A4>4, and B1 – B2 if A4£4. • SUMIF =SUMIF(F1:F12,“>60”,G1:G12) • Returns G1+G2+…+G12 only if F1+F2+…+F12>60 2-656-97 Méthodes d ’aide à la décision en RO
Basic Excel functions and operators • VLOOKUP =VLOOKUP(6.6,A1:E6,4) • If the values in column A of a given table [A1:E6] are sorted (in an ascending order), VLOOKUP finds the largest value in column A that is less than or equal to 6.6, identifies the row it belongs to, and returns the value in the fourth column that correspond to this row.Note: If the values in column A are not sorted, =VLOOKUP(6.6,A1:E6,4,FALSE) finds the value 6.6 in column A, identifies the row it belongs to, and returns the value in the fourth column that corresponds to this row. 2-656-97 Méthodes d ’aide à la décision en RO
Basic Excel functions and operators • Statistical/Optimization • Data Analysis [Selected from the Tools menu]. Useful entries: • Descriptive Statistics • Regression • Exponential Smoothing • Anova 2-656-97 Méthodes d ’aide à la décision en RO