Download
1 / 27
270 likes | 356 Vues
MANAGING WATER QUANTITY AT ALLOCATION LIMITS Freshwater Management Forum 2013 Professor Bryan Jenkins Waterways Centre: University of Canterbury and Lincoln University. PRESENTATION COVERAGE. Major Issues around Over-Allocation Examples of Claw-back Strategies

E N D
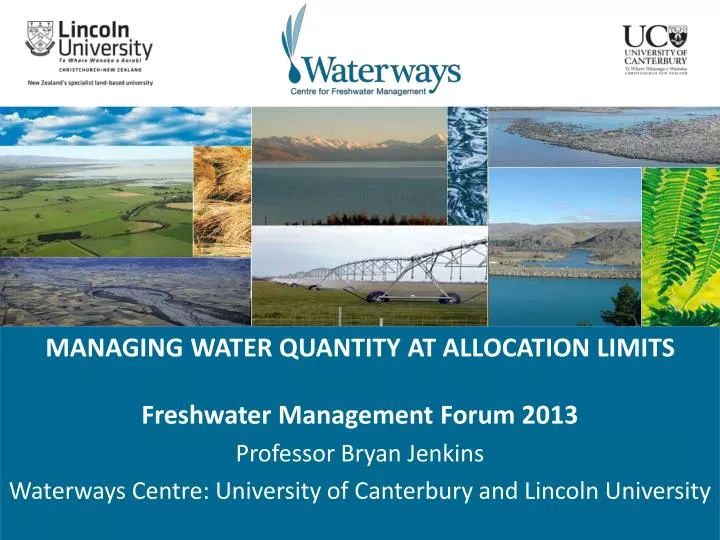
MANAGING WATER QUANTITY AT ALLOCATION LIMITS Freshwater Management Forum 2013 Professor Bryan Jenkins Waterways Centre: University of Canterbury and Lincoln University
PRESENTATION COVERAGE • Major Issues around Over-Allocation • Examples of Claw-back Strategies • Adaptive Management Approaches • Mitigating Effects on Existing Users • Exchange Mechanisms and Incentives
WATER ALLOCATION BASED ON RMA sec 5 • Enabling resource use for social, economic and cultural well being, while • sustaining resource for use of future generations • safeguarding life supporting capacity • avoiding, remedying or mitigating adverse effects • Main over-allocation concerns • replenishment of aquifers • ecological flows in rivers • water quality effects of water use • reliability of supply for existing users
PAREORA: EXAMPLE OF CLAW-BACK • Foothill River South Canterbury • irrigation • town supply • industry
ALLOCATION LIMITS SET BY CATCHMENT BOARD • Total consented allocation • - 940 l/s (142% of 7D MALF c.f. interim limit 30%) • Minimum flow • - 300 l/s (45% of 7D MALF c.f. interim limit 90%) • Notes: • Mean Annual Low Flow (7 day): lowest flow over 7 consecutive days in a year; average of annual values over data record (660 l/s for Pareora River) • Interim Limits: from Proposed NES for ecological flows
OUTCOME OF COLLABORATIVE AND RMA PROCESSES • “A Block” Allocation • - 198 l/s (30% MALF) • Minimum flows next 5 years (Dec-Sep) • - 50% restriction at 400 l/s • - total cessation at 300 l/s • Minimum flows after 5 years (Dec-Sep) • - 50% restriction at 470 l/s • - total cessation at 400 l/s • Minimum flow for A Block holders to take to storage • - 1600 l/s • Establish B Block allocation • - 2500 l/s at minimum flow of 5000 l/s
BALANCING WATER PROTECTION AND ECONOMIC DEVELOPMENT • Involve those affected in a collaborative process • Give the outcome of that process statutory backing • Allow time for transition to increased water protection • Provide water at higher river flows for storage to offset loss on run-of-river allocation • Existing users get access to higher flows ahead of new applicants
RAKAIA SELWYN LIMITS • Rapid growth in use of groundwater • Sustainability limit exceeded • Drop in groundwater levels and spring-fed streams First order limit 208 Mm³
ADDING CONTROLS FOR CUMULATIVE EFFECTS TO INTERFERENCE CONTROLS Restorative Programme for Lowland Streams • Annual limits on consents in fully allocated zones • Metering of groundwater wells • Restrictions on wells with hydraulic connection to lowland streams • Ability to vary limits based on water in groundwater system
GROUNDWATER ALLOCATION AND ADAPTIVE MANAGEMENT • Current groundwater allocation • - annual consented volume based on volume needed in a dry year (1 in 5 year drought): not needed 4 years out of 5 • - instantaneous volume (rate of pumping) limited by interference effects on neighbouring bores • - zone allocation limits based on average use and past irrigation practices to protect groundwater levels and flows in groundwater-fed streams
ANTECEDENT RECHARGE PROPOSAL • At full allocation in a period of low recharge it is not possible to: • - provide consented volumes, and • - maintain flows in groundwater-fed streams • Adaptive alternative: relate allocation to antecedent recharge: • - base entitlement as fixed percentage of consented annual allocation • - adaptive entitlement as variable amount based on recent recharge history
SIMULATION OF ANTECEDENT RECHARGE ALLOCATION 1960-2009 Source: Williams et al 2008
TE NGAWAI RIVER • Foothill river in South Canterbury • Natural flow falls below minimum flow • River goes on restriction • Incentive for individual users to get as much as possible as soon as possible
COLLABORATIVE GOVERNANCE TRIAL • Water User Group of • irrigators established • Real time measurement of • irrigation takes and river flow • Results telemetered to internet site so farmers knew total take, their take and river flow • Voluntary adjustments by irrigators to maintain flow above restriction levels for as long as possible
MITIGATION OF EFFECTS ON EXISTING USERS • Creation of priority bands for existing users to help retain reliability of supply • Provision of storage to complement run-of-river or groundwater supply • Increased water use efficiency so that less water is needed for same level of production • Establishment of exchange mechanisms to facilitate water transfers
WAIMAKARIRI RIVER ALLOCATION • “A” Block allocation of 22 cumecs with minimum flow of 46 cumecs • Application from Central Plains Water for 25 cumecs • If Central Plains given same status as existing users then significant reduction in reliability • New flow allocation • - AA 5 cumecs community and stock water • - A 17 cumecs: minimum flow 46 cumecs • - B 27 cumecs: minimum flow 68 cumecs (1:1 sharing)
INCREASE WATER AVAILABILITY THROUGH STORAGE • Much of surface water irrigation supply is run-of-river • When peak demand exceeds available river flow then irrigation restricted • Annual water availability sufficient to meet annual demand but requires storage • Concerns about sustainability of storage schemes in relation to river systems • Consideration of: • - diversion to tributary storage (Waitohi) • - off-river storage (Rangitata South) • - aquifer recharge (Central Plains) • - on-farm storage (Canterbury Plains)
INCREASED WATER USE EFFICIENCY • More efficient irrigation methods • - match irrigation application to times of and degree of soil moisture deficit • Lower irrigation application rates • - reduce leakage from macropore flow • Improve reliability of supply • - ‘just in time’ rather than ‘just in case’ • Use piped distribution rather than open channels • - water savings, reduced on-farm pumping • Redistribution of irrigation source • - enhance recharge by using surface water in upper catchment and groundwater in lower catchment
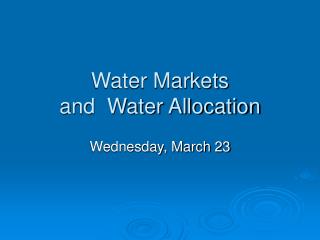
EXCHANGE MECHANISMS • Collaborative agreements • - Te Ngawai water user group • Transfers under RMA • - problem of consenting • Cap and trade • - Murray Darling basin; Lake Taupo nitrates • Brokerage • - concept in CWMS
WATER MARKETS IN MURRAY DARLING BASIN • Cap on diversions in 1994: property rights in water created • Increase in value of entitlements and increase in irrigator wealth • In the “long dry” - allocations insufficient to keep all valuable permanent plantings in production but enabled non-producers to sell allocation - increased downstream salinity such that irrigators could not use water but able to sell allocation Source: Young, 2011
RESULT OF DIVERSION CAP AND TRADING • Increased water use efficiency reduced return flows • Increased capture of overland flows • Sale of end-of-season storage • Over allocation problems worsened • River Murray stopped flowing in 2002 • Cap should have been on nett use rather than diversion • Need incentives to carry forward unused stored water • 1500 GL of cap equivalent needed to restore health
COMMONWEALTH INTERVENTIONS • 500 GL secured for environment (2004-9) • Additional commitment for $3.1 b purchase of water entitlements • Investment in irrigation efficiency $5.8 b • Taxpayer cost ($8.9 b) for 15,120 irrigators ($588,000 per irrigator) • Subsidised investment worked to disadvantage to those farmers who had paid for their improvements
LAKE TAUPO APPROACH • Target: reduce nitrogen load by 20% to bring lake back to 1990 levels • Farms occupy 18% of land but contribute more than 90% of the manageable nitrogen • Market for nitrogen: farmers and Lake Taupo Protection Trust • Farmer can either reduce nitrogen load or purchase nitrogen discharge allowance • Trust has $81.5m fund and will stand in the market to purchase nitrogen discharge allowances and/or farmland
Map of modelled Mean Transit Time of the water from land to lake in western lake catchment Predicted N load for Lake Taupo from all northern and western streams and seeps Lake Taupo M.A. Gusyev, M. Toews, U. Morgenstern, M. Stewart and J. Hadfield (submitted). Calibration of a transient tritium transport model to tritium time series data from rivers and streams in the western Lake Taupo catchment, New Zealand. Hydrol. Earth Syst. Sci, (submitted) MS No.: hess-2012-318
CONCEPT OF BROKERAGE • Providing incentives for existing users to improve water use efficiency and land use practices affecting water quality • - linking efficiency requirements to access to reliable water from storage • - inefficient or unproductive water to be bought out and water re-allocated for environmental or productive purposes • - third party investment in efficiency gains in exchange for water savings
MANAGING AT AVAILABILITY LIMITS • Issues: aquifer replenishment, ecological flows, water quality effects, supply reliability • Approaches: involvement, statutory backing, time to adjust, alternative access • Adaptive Management: incorporate natural variability, integrated measurement • Existing Users: priority bands, storage, improved efficiency, exchange mechanisms • Exchange mechanisms: collaborative governance, transfers, cap and trade (?), brokerage