Download
1 / 42
420 likes | 679 Vues
Radars. Sandra Cruz-Pol Professor Electrical and Computer Engineering Department University of Puerto Rico at Mayagüez CASA- C ollaborative A daptive S ensing of the A tmosphere 2006. What is a Radar? Ra dio d etection a nd r anging. How does a radar work? Radar Concepts Games.

E N D
Radars Sandra Cruz-Pol Professor Electrical and Computer Engineering Department University of Puerto Rico at Mayagüez CASA- Collaborative Adaptive Sensing of the Atmosphere 2006
What is a Radar?Radio detection and ranging • How does a radar work? • Radar Concepts • Games
The frequency of the em wave used depends on the application. Some frequencies travel through clouds with virtually no attenuation. ALL em waves move at the speed of light
Acoustic Echo-location hello
Acoustic Echo-location hello distance
Hi !! time Hi !! t = 2 x range / speed of sound Example:range= 150 m Speed of sound≈340 meters/second t= 2 X 150 / 340 ≈ 1 second
RADAR Echolocation(RADAR ~ RAdio Detection And Ranging)“Microwave Echo-Location” Tx Rx Microwave Transmitter Receiver
Target Range Tx Rx time t = 2 x range / speed of light measure t, then determine Range Example:t = .001 sec Speed of light = c = 3x10⁸ meters/second Range = .001 x 3x108 / 2 = 150,000 m = 150 km
Thresholding Threshold Voltage time • Measure time elapsed between transmit pulse • and target crossing a threshold voltage. • Then calculate range. • Don’t “report back” any information from targets that • don’t cross the threshold
Range-Gating Range Gates time
We will see that Radars work by… • Transmitting microwave pulses…. • and measuring the … • Time delay (range) • Amplitude • Frequency • Polarization • … of the microwave echo in each range gate
Target Size Scattered wave amplitude conveys size of the scattering objects. Measure amplitude, determine size. time
Target Radial Velocity Frequency ft Frequency ft+ fd
Target Radial Velocity Frequency ft Frequency ft+ fd
Zero Velocity for “Crossing Targets” Frequency ft Doppler Frequency Frequency ft+ fd
Closer look at Large drop Target Spatial Orientation Large Drops Polarization Pt Small Drops Polarization Ps
Example: Weather Echoes Microwave Transmitter Receiver
Echo versus Range(range profile) Transmitted Pulse #1 Cloud Echo time
In summary, radars work by… Transmitting microwave pulses…. and measuring the … … of the microwave echo in each range gate • Time delay (range) • Amplitude (size) • Frequency (radial velocity) • Polarization (spatial orientation & “oblateness”)
Colors in radar images • The colors in radar images indicate the amount of rain falling in a given area. • Each raindrop reflects the energy from the radar. Therefore, the more raindrops in a certain area, the brighter the color in the radar image of that area. • The bright red color around the eye of a hurricane radar image indicates the area of heaviest rainfall. The green colored area has a moderate amount of rain, while the blue areas represent the least amount of rain. Hurricane Andrew, 1992
QPE – Quantitative Precipitation Estimation 0.1 mm/hr 1 mm/hr 15 mm/hr 100 mm/hr >150 mm/hr
Why Radar Can't (Usually) See Tornadoes • The network of WSR-88D Doppler radars across the US has certainly proven itself for the ability to detect severe weather. Tornado warnings, in particular, are much better now that National Weather Service forecasters have this fantastic new (new as of the early 1990s) tool. • But did you know that Doppler radar (usually) can't see an actual tornado? When Doppler radar is cited in a tornado warning it is generally because meteorologists see evidence the storm itself is rotating. It is a supercell thunderstorm or at least contains an area of rotation called a mesocyclone. • When can and when can't Doppler radar see a tornado? It's math! Let's figure it out. We'll be looking into two factors: • 1) the first is something you learned in school a loooong time ago - the earth is curved, and • 2) the radar "beam" is 1 degree wide.
CASA radars will complement NWS radars Water spout at Mayaguez Beach, PR- Sept 2005 –unseen by NEXRAD
Radar "Beamwidth" • The geometry of the dish and a few other factors help determine the pulse volume, which can be specified in degrees. • NEXRAD radar sends discrete pulses (and spends 99.57% of the time listening for return echoes) • Meteorologists like to use the convenient terms "beam" and "beamwidth" to describe where the radar is pointing and the effective resolution of the air being sampled.
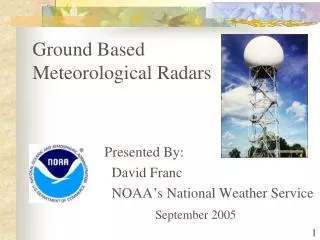
Antennas • Antenna is a transition passive device between the air and a transmission line that is used to transmit or receiveelectromagnetic waves.
Antenna Beamwidth radians D is the antenna diameter λ is the wavelength of signal in air Tradeoff: Small wavelengths (high frequencies) = small antennas But small wavelengths attenuate more
Beamwidth Size vs. Object Size Beamwidth • What can a radar see? Beamwidth is one consideration. Earth curvature and height of the feature is another (addressed on the next page). • For the moment, we'll keep the problem in two dimensions and ignore height above ground. • The geometry is an isosceles triangle. Be sure to note which beamwidth you are calculating for (i.e. 1 degree).
Beamwidth 0.7 mi 1.4 mi 2.1 mi 2.8 mi
Object Size How wide and tall are various things we want to see? Width of Meteorological Objects (i.e. Storms, Tornadoes)
Earth Curvature Fill in the table with values you calculate 0.17 mi 0.35 mi 0.52 mi 0.70 mi 7 mi 16 mi 23 mi 31 mi
Play the gamesto learn the basics • http://whyfiles.org • http://meted.ucar.edu/hurrican/strike/index.htm • http://meted.ucar.edu/hurrican/strike/ • http://meted.ucar.edu/hurrican/strike/info_3.htm# • http://www.nws.noaa.gov/om/hurricane/index.shtml • http://www.nws.noaa.gov/om/edures.htm
More Games for Kids 4-104 http://www.nws.noaa.gov/om/reachout/kidspage.shtml
References • The COMET project [http://www.comet.ucar.edu/] • NASA TRMM • NCAR (National Center for Atmospheric Research) - University Corporation for Atmospheric Research (UCAR) • NOAA Educational Page [http://www.nssl.noaa.gov/edu/ideas/radar.html] • Dave McLaughlin Basics of Radars presentation • NWS [http://www.crh.noaa.gov/fsd/soo/doppler/doppler.htm]