Download
1 / 36
360 likes | 491 Vues
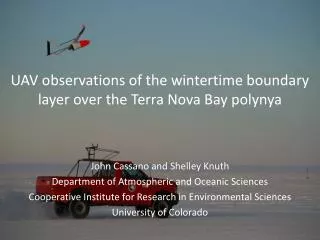
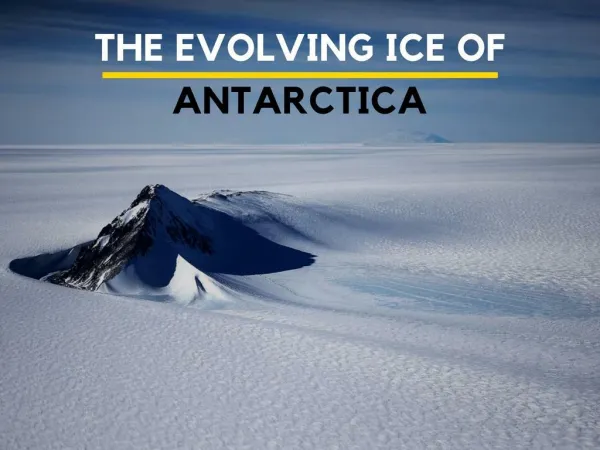
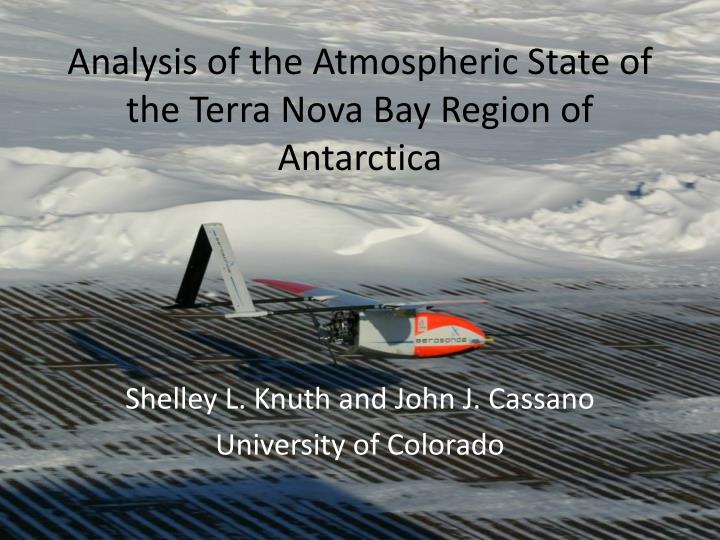
Analysis of the Atmospheric State of the Terra Nova Bay Region of Antarctica. Shelley L. Knuth and John J. Cassano University of Colorado. Purpose. UAVs flown over TNB in Sept. 2009 Analyze air-sea interactions Wind, temperature, pressure, and relative humidity data collected

E N D
Analysis of the Atmospheric State of the Terra Nova Bay Region of Antarctica Shelley L. Knuth and John J. Cassano University of Colorado
Purpose • UAVs flown over TNB in Sept. 2009 • Analyze air-sea interactions • Wind, temperature, pressure, and relative humidity data collected • 16-year analysis of weather in TNB • Preliminary analysis of results • TNB • Ross Island • Comparison between UAV and AMPS data
Importance of TNB • Strong downslope flow from area glaciers • Local (katabatic) winds driven largely by synoptic flow pattern • Formation of coastal polynya
Climatology of TNB - Purpose • Determine typical winds and temperatures in TNB • UAV observations in context • Focus on: • Background flow field • Temperature • Cyclonic systems
Climatology of TNB - Data • Data Used: • Rita AWS • Temperature • Wind • Jan. 1993-Nov. 2007, Sept. 2009 • Satellite • NOAA-18 and NOAA-19 Infrared Local Area Coverage (LAC) data • Aug.-Oct. 2006-2008, Sept. 2009
Rita AWS • Operated by Italian Antarctic Research Programe • Measures temperature, relative humidity, pressure, and wind speed and direction • Stands 10 m • 2 48-Watt solar panels, 6 lead acid batteries
Satellite Climatology • Manual analysis of IR images • Entire Ross Sea • Size • Mesocyclones (less than 1000 km) • Shape • Comma, spiral-form, single- cyclonic band, and merry-go-round • Location
High Winds at TNB • Winds in excess of 20 m/s for minimum of 10 hours • Allowed to drop below threshold for 10 hour • Seefeldt and Cassano (2008) • 10 hour minimum duration for determining high wind events • Testing of data • Other thresholds tested • 20 m/s most representative of 10 hour duration events • Morales Maqueda (2004) • Indicates 20 m/s the wind speed where the polynya opens
Wind Climatology Results • 55% of winds from west to north-westerly directions • 86% of winds are less than 20 m/s • 83% of winds greater than 20 m/s from west to northwesterly directions • Maximum winds were 58 m/s
Temperature Climatology Results • 52% of observations fall between -15 and -25°C • 45% of obs. are warmer • 16% are colder • Sharp (gradual) decrease toward colder (warmer) temperatures • Warmer: cyclones, strong winds mix out inversion • Colder: calm days with strong surface inversion
High Wind Events - Results • 418 high wind events found • Winter had 68% of high wind events • Autumn: 17% • Spring: 11% • Summer: 4% • Most high wind events in July (14%) • Least in January (1%)
High Winds and Cyclonic Activity • Comparison during August-October 2006-07 • 15 high wind events found • 100% were coincident with cyclonic activity in Ross Sea
Cyclone Locations • High density of mesocyclones in lee of Ross Island • Lack of cyclone activity in central Ross Sea
Cyclone Characteristics • 84% of cyclones were mesocyclones • 63% were less than 500 km • Most systems (64%) were comma shape • Spiralform – 25% • Single-cyclonic band – 6% • Merry-go-round – 3%
Comparison of Climatological Winds to Sept. 2009 Winds • Sept. 2009 had lighter winds • Winds were more westerly • Only one high wind event in Sept. 2009 • Average was 3.4 events in climatological Septembers
Comparison of Climatological Cyclones to Sept. 2009 Cyclones • TNB saw fewer cyclones • Eastward shift in cyclone activity in Sept. 2009 • 600% more cyclones in cyclone void region shown previously
Synoptic Situation in Sept. 2009 • NCAR/NCEP Reanalysis shows eastward shift in upper-level trough
September 2009 • Upper level trough shifts cyclones to east • Not as able to influence downslope winds in TNB • Less high wind events • Shift in wind directions • Slower winds • Sept. 2009 was an anomalous year
UAV Flights • Eight flights to TNB • Sixteen flights total • McMurdo to TNB • Flew several horizontal legs in TNB • Flying time varied • Generally around 12-18 hours • Analysis of wind data shown
Winds in TNB • Fastest winds downstream of Reeves Glacier • Winds shift direction depending on synoptic situation • Winds downstream of David Glacier very light • Wind shift over Drygalski Ice Tongue
Winds in this case also more streamlined • Surface low too far east • But perhaps is influencing ridge/trough in central Ross Sea? • See shift over Drygalski also
See cyclonic and anti-cyclonic vortices in first three cases • Not in others • Perhaps due to placement of surface low?
Comparison of UAV Data and AMPS Output • Seem to see much better correlation with 10m winds and UAV winds in weaker flow • Case 2 high winds are not seen in 10 m winds • Perhaps because jet is shallow?
Comparison of UAV Data and AMPS Output • Model predicts vortices in lee of Ross Island well • However sometimes placement of vortex is off
Summary - Climatology • Eight UAV flights between McMurdo and TNB in September 2009 • 16 year climatology shows most winds in TNB downslope in origin • Most winds at Rita less than 20 m/s • Temperatures between -15 and -25°C • Winter sees fastest winds • Most cyclones are mesocyclones and comma shaped • Shift in upper level pattern in Sept. 2009 leads to anomalous year
Summary – UAV Data • Winds from UAV flights show some correlation between synoptic pattern and winds in TNB • Have three flights where UAV data confirms vortices in lee of Ross Island • Winds in TNB generally in excess of 15 m/s • 20 m/s downstream of Reeves Glacier • AMPS does fairly well with predicting wind patterns
Future Work • What drives the winds in Terra Nova Bay? • Analysis of synoptic pattern during each flight • How does the downslope flow modify the air over the open water polynya and vice versa? • How well does AMPS predict the patterns seen in the UAV wind data?
Acknowledgments • Paolo Grigioni of PNRA for help with the Rita AWS data • Matthew Lazzara of AMRC for providing the satellite composite data • Melissa Richards of University of Colorado for the cyclone maps • This project is funded by NSF grant ANT 0739464
TNB Polynya • Offshore coastal polynya • Highly sustainable • Large energy transfer from ocean to atmosphere • Convective boundary layer • Generation of sea ice • Dense water in polynya • Primary contributor to Antarctic Bottom Water
Temperature Changes with Wind Speed • Lowest has bimodal peak • Summer and winter • Highest category has single peak • Strong downslope winds • Intermediate has Gaussian peaks • Downslope winds and cyclones
Sensible and Latent Heat Fluxes • Sensible Heat Fluxes • Climatologically: • Winter: Typically around 600 W/m2 • Summer: Typically less than 100 W/m2 • September 2009 • Highest values around 600 W/m2 • Latent Heat Fluxes • September 2009 • Generally around 100 W/m2
Seasonal Average Wind Speeds and Temperatures • Spring • Wind: 9.0 m/s • Temperature: -12.7°C • Summer • Wind: 6.1 m/s • Temperature: -3.3°C • Autumn • Wind: 10.1 m/s • Temperature: -12.7°C • Winter • Wind: 11.1 m/s • Temperature: -21.6°C