Download
1 / 22
290 likes | 572 Vues
Independent and Dependent Variables. Correlation. Continuous and Discrete Data. In an Algebraic situation, equation , table, or graph, the variables (usually x and y) can be classified as either __________ or _________. independent. dependent. Independent Variable. x-axis.

E N D
Independentand Dependent Variables Correlation Continuous and Discrete Data
In an Algebraic situation, equation, table, or graph, the variables (usually x and y) can be classified as either __________ or _________. independent dependent
Independent Variable x-axis The independent variable is always located on the _________ of a graph. The independent variable is the ________________. It is usually the ________ in a table or equation. The independent variable STANDS ALONE (___________). The independent variable is what happens _______. Input (domain) “x” Does not depend FIRST
The variable in a function whose value is subject to choice is the independent variable. The independent variable affects the value of the dependent variable.
Dependent Variable The dependent variable is always located on the _________ of a graph. The dependent variable is the ______________. It is usually the _______ in a table or equation. The dependent variable DEPENDS on the ________________. The dependent variable is what happens _______. y-axis Output (Range) “y” independent variable 2nd
The variable in a function whose value is determined by the independent variable.
Let’s Practice! • A student’s grade depends on how much she studies. Independent variable:__________ Dependent variable:___________ 2. The height of a plant and the amount you water it. Independent variable: ___________ Dependent variable: _____________ Time studying grade Amount watered height
3. The amount of money you make and the number of hours you work. Independent variable: _____________ Dependent variable:_____________ 4. The number of sodas you buy and the total money spent. Independent variable:______________ Dependent variable:_______________ 5. The number of houses you can paint depends on how much time you have. Independent variable:______________ Dependent variable:_______________ Hours worked Amount of money Number of sodas Total money Amount of time Number of houses
Continuous Data Data that is continuous is data that _________ happens. You can usually tell that your data is continuous if you are _________ something (i.e. time, distance, length, height, etc.). If your data is continuous, then you will _________ the points on your graph. continuously measuring connect
Discrete Data You can tell that your data is discrete if you are ________________________ (i.e. number of people, cars, or stories of a building). If your data is discrete, then you will _____________ the points on your graph. counting or measuring in whole numbers NOT connect
Let’s Practice Look at the situations given in examples 1-5. Decide if the situation would best be classified as either discrete or continuous data. 1. A student’s grade depends on how much she studies. 2. The height of a plant and the amount you water it. 3. The amount of money you make and the number of hours you work. 4. The number of sodas you buy and the total money spent. 5. The number of houses you can paint depends on how much time you have. continuous continuous discrete discrete continuous
Example Kadence collected data on the number of push-ups she could do in 2 minutes. The table below shows her data. Time (seconds) • What is the independent variable? • Is the data continuous or discrete? Discrete – counting push-ups
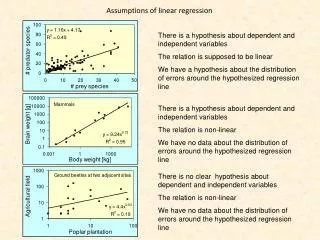
Correlation • It is the relationship that exists between two variables (Independent and dependent).
y x Positive Correlation • As one variable increases, so does the other.
Example of positive correlation… The longer you exercise, the more calories you burn. *As exercise increases, calories burned increases Can you think of one?
y x Negative Correlation: • As one variable increases, the other decreases.
Example of negative correlation… The longer the air conditioner is turned on, the colder the temperature. *As time increases, the temperature decreases Can you think of one?
y x No Correlation: • As one variable increases, you cannot tell what the other is doing.
Example of no correlation… The number of students in the classroom and the average height. *As the number of students increases, you cannot tell what the average height will do. Can you think of one?
Everything… The amount of time you spend in an airplane and the distance between your departure and your destination. 1. What are the independent and dependent variables? Independent: Distance Dependent: Time 2. Would this situation represent a discrete or continuous situation? Continuous 3. What type of correlation is represented in this situation? Negative correlation
Everything again… The number of times you dip a wick into hot wax and the diameter of a handmade candle 1. What are the independent and dependent variables? Independent: The number of dips Dependent: diameter of candle 2. Would this situation represent a discrete or continuous situation? Discrete 3. What type of correlation is represented in this situation? Positive correlation