Download
1 / 30
310 likes | 414 Vues
The Economics of the Energy Market. Dr. Myles Watts Department of Ag. Econ. & Econ. Montana State University and April 2012. Energy Market Discussion. Energy Facts Quiz Domestic Energy Flow and Use Oil and Gasoline Prices. Energy Facts Quiz. List in order of magnitude:

E N D
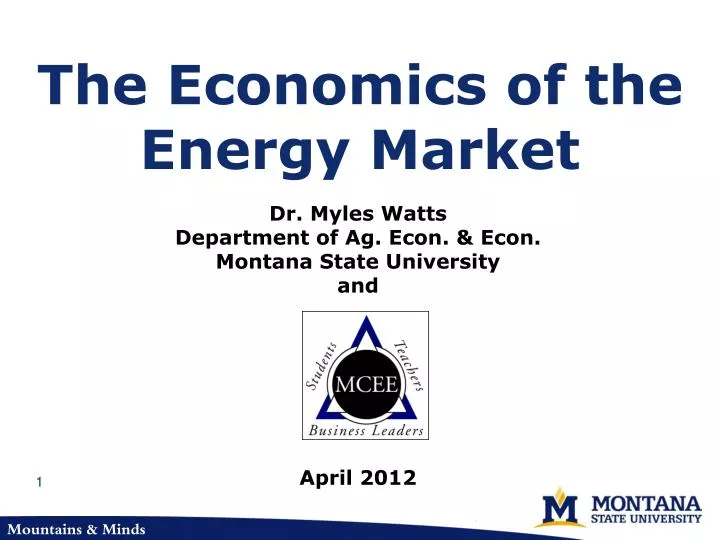
The Economics of the Energy Market Dr. Myles Watts Department of Ag. Econ. & Econ. Montana State University and April 2012
Energy Market Discussion Energy Facts Quiz Domestic Energy Flow and Use Oil and Gasoline Prices
Energy Facts Quiz • List in order of magnitude: • The U.S. energy sources Coal, Natural Gas, Nuclear, Petroleum, Renewable • France’s energy sourcesCoal, Natural Gas, Nuclear, Petroleum, Renewable • The U.S. energy usesCommercial, Industrial, Residential, Transportation
Energy Facts Quiz • List in order of magnitude (cont.): • The top three oil producing nations • The top six nations that produce oil consumed in the United States
Energy Facts Answers • The U.S. energy sources • (Coal, Natural Gas, Nuclear, Petroleum, Renewable). • Petroleum (includes Crude Oil) – 41.5% • Natural Gas – 22.1% • Coal – 22.08% • Nuclear – 8.4% • Renewable – 8.0% U.S. Energy Information Administration (www.eia.gov), Energy Statistics
Energy Facts Answers • France’s energy sources (2008) • (Coal, Natural Gas, Nuclear, Petroleum, Renewable) • Nuclear – 39% • Petroleum – 36% • Natural Gas – 17% • Renewable – 7% • Coal – 4% U.S. Energy Information Administration (www.eia.gov), International Energy Statistics
Energy Facts Answers • The U.S. energy uses (Commercial, Industrial, Residential, Transportation) • Industrial – 30.14% • Transportation – 27.51% • Residential – 22.51% • Commercial – 18.21% U.S. Energy Information Administration (www.eia.gov), Energy and International Energy Statistics
Energy Facts Answers • The top three oil producing nations • (in order of magnitude) • Saudi Arabia • Russia • United States U.S. Energy Information Administration (www.eia.gov), Energy and International Energy Statistics
Energy Facts Answers • The top six nations that produce oil consumed in the United States U.S. Energy Information Administration (www.eia.gov) Energy and International Energy Statistics
Energy Flow 2010 U.S. EIA Annual Energy Report 2010 Figure 1 (see report for footnotes)
Oil and Gasoline Prices Historical Energy Prices Montana Oil Production Exchange Rates World Income U.S. Refinery Capacity
U.S. Energy Consumptionby Source and Sector 2011 (quadrillion Btu) U.S. EIA Annual Energy Report 2010 Figure 2 (See report for footnotes)
Crude Oil Prices Since 1861 Growth of Venezuelan production Sumatra production began Loss of Iranian supplies Netback pricing introduced Asian financial crisis Post-war reconstruction Fears of shortage in US Invasion of Iraq Russian oil exports began Yom Kippur war Suez crisis East Texas field discovered Discovery of Spindletop, Texas Pennsylvanian Oil Boom Iraq invaded Kuwait Iranian revolution CRUDE OIL PRICES 1861 – 2011 (US dollars/barrel) 1861-1944 US Average 1945-1985 Arabian Light posted at Ras Tanura 1986-2011 OK WTI Spot Price FOB U.S. EIA: BPCrudeOilPrices.xls, Cushing OK WTI Spot Price FOB, Inflation Data BLS and Minneapolis Federal Reserve
Proven Oil Reserves (%) 997 Billion Barrels 1028 Billion Barrels 1469 Billion Barrels U.S. Energy Information Administration (www.eia.gov), International Energy Statistics
Reserves at End 2011Total 1469 Billion Barrels U.S. Energy Information Administration (www.eia.gov), International Energy Statistics and Annual Energy Outlook 2011
Oil Reserves-to-Production (R/P) Ratios U.S. Energy Information Administration (www.eia.gov), International Energy Statistics and Annual Energy Outlook 2011
Gasoline Prices Since 1919Dollars per Gallon U.S. EIA Motor Gasoline Regular Grade Retail Prices (Annual)
Recent Gas & Diesel Prices 19 U.S. EIA Petroleum and Other Liquids Pricing
Montana Crude First Purchase Price 20 U.S. EIA Petroleum and Other Liquids Pricing BLS CPI
Exchange Rates • Most crude oil purchased elsewhere: U.S. Energy Information Administration (www.eia.gov) Energy and International Energy Statistics 21
Financial Influences(Inflation and Exchange Rates) U.S. EIA Petroleum and Other Liquids Pricing, BLS CPI, Federal Reserve Exchange Rates 22
Financial Influences(Inflation and Exchange Rates) NOTE: Subject to “Fallacy of Composition” criticism. U.S. EIA Petroleum and Other Liquids Pricing, BLS CPI, Federal Reserve Exchange Rates
World Income 24 China’s personal income has been increasing at about 10% per year (real) for nearly two decades. U.S. personal income has also increased substantially. Personal income and GDP worldwide continues to increase.
U.S. Personal Real Income 25 Bureau of Economic Analysis National Income and Accounts Tables BLS CPI All Urban Consumers
World GDP: Historical Trend 26 World Bank National Accounts Data
U.S. Refinery Capacity U.S. Energy Information Administration U.S. Refinery Utilization and Capacity No new refineries built in the United States since 1978 Some expansion in U.S. refinery capacity 27
Montana Oil Production1981 - 2011 28 U.S. Energy Information Administration Montana Crude Oils First Purchase Price and Field Production
Montana Oil Production ForecastQt = Oil Production (1000 barrels) in year tP = Price of Oil (2011$/barrel) Qt = 1.9P.087Qt-11.48Qt-2-.704 R2 = .96Price Elasticity = 9% (Estimated in Logs) Data: EIA Annual MT Crude First Purchase Price, 1983 to 2011 Estimated by Doug Young 29