Download
1 / 62
670 likes | 872 Vues
Constraining Hydrological Cycle Characteristics of Early Eocene Hyperthermals . Srinath Krishnan. Reasons for study. Rainfall has direct impact on human society Impact of anthropogenic activity on rainfall patterns is not well understood

E N D
Constraining Hydrological Cycle Characteristics of Early Eocene Hyperthermals Srinath Krishnan
Reasons for study • Rainfall has direct impact on human society • Impact of anthropogenic activity on rainfall patterns is not well understood • Modern studies suggest intensification of hydrological cycle with warming • Wet Wetter • Dry Dryer • Lack of data inhibits validation of these models in a complex natural system
Reasons for study • Rainfall has direct impact on human society • Impact of anthropogenic activity on rainfall patterns is not well understood • Modern studies suggest intensification of hydrological cycle with warming • Wet Wetter • Dry Dryer • Lack of data inhibits validation of these models in a complex natural system
Reasons for study • Rainfall has direct impact on human society • Impact of anthropogenic activity on rainfall patterns is not well understood • Modern studies suggest intensification of hydrological cycle with warming • Wet Wetter • Dry Dryer • Lack of data inhibits validation of these models in a complex natural system
Reasons for study • Rainfall has direct impact on human society • Impact of anthropogenic activity on rainfall patterns is not well understood • Modern studies suggest intensification of hydrological cycle with warming • Wet Wetter • Dry Dryer • Lack of data inhibits validation of these models in a complex natural system
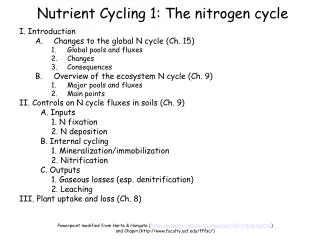
Early Eocene Hyperthermals Paleocene-Eocene Thermal Maximum • ~3-50C rise in temperature • Negative carbon isotope excursion of 2.5-6‰ Eocene Thermal Maximum-2 • Smaller rise in temperature compared to the PETM set on a warming trend • Carbon isotopic excursion about half of the PETM Adapted from Zachos et al. (2001)
Early Eocene Hyperthermals • Causes • Methane Hydrates (Dickens et al., 1995) • Burning of terrestrial organic matter (Kurtz et al., 2003) • Estimates of greenhouse gas concentrations • Pre-PETM: ~600 – 2,800 ppm of CO2 • PETM: ~750 – 26,000 ppm of CO2 • ~1,500 – 55,000 Gt C in the atmosphere • ~3,900 – 57,000 Gt C released in the oceans • Modern atmospheric CO2 concentration: ~360 ppm • Modern Conventional fossil fuel reserves: ~5,000 Gt C
Early Eocene Hyperthermals • Causes • Methane Hydrates (Dickens et al., 1995) • Burning of terrestrial organic matter (Kurtz et al., 2003) • Estimates of greenhouse gas concentrations • Pre-PETM: ~600 – 2,800 ppm of CO2 • PETM: ~750 – 26,000 ppm of CO2 • ~1,500 – 55,000 Gt C in the atmosphere • ~3,900 – 57,000 Gt C released in the oceans • Modern atmospheric CO2 concentration: ~360 ppm • Modern Conventional fossil fuel reserves: ~5,000 Gt C
GOAL • Use early Eocene hyperthermals as analogues to study changes in the hydrological cycle during extreme warming events
Schematic of a Water Cycle Adapted from NASA Goddard Flight Center
Expected changes with warming • Increased lower tropospheric water vapor • In the extra-tropics, the important components of the hydrological cycle that affect isotopic signals are • Horizontal poleward flow of moisture • Changes in precipitation and evaporation Dr. Raymond Schmitt: http://www.whoi.edu/sbl/liteSite.do?litesiteid=18912&articleId=28329
Variations in Precipitation with warming 2.80c in 2100 Increased Evaporation Held and Soden (2006)
Variations in Precipitation with warming 2.80c in 2100 Increased Precipitation Held and Soden (2006)
Modern annual precipitation http://www.waterisotopes.org
Rayleigh Distillation Clark and Fritz, 1997
Rayleigh Distillation Increased depletion with progressive rainout events Clark and Fritz, 1997
Hypotheses • There is a systematic change in moisture transport to the higher latitudes during warming events • Are there similar changes in δD between the two hyperthermals at the higher latitudes? • Can these changes be detected on a global scale? • Can this theoretical model be reproduced with an isotope coupled climate model?
Proxies • n-alkanes: Single chain hydrocarbon with long chain lengths (n-C23-35) indicating terrestrial plant/leaf wax sources • Compound-specific hydrogen isotopic composition represents meteoric water modified by evapotranspiration • Compound-specific carbon isotopic compositions represents environmental and ecological conditions
Proxies • n-alkanes: Single chain hydrocarbon with long chain lengths (n-C23-35) indicating terrestrial plant/leaf wax sources • Compound-specific hydrogen isotopic composition represents meteoric water modified by evapotranspiration • Compound-specific carbon isotopic composition represents environmental and ecological conditions
n-alkanes and precipitation Deuterium n-alkanes Adapted from Sachse et al., 2006)
Biomarker transport Continent Oceans Aerosols (with waxes) Wind Terrestrial Plants Rivers Adapted from Eglinton and Eglinton, 2008
Methods Samples Crushing and Extraction Total Lipid Extract Compound Separation n-alkane and biomarker fractions Clean-up Procedures Gas Chromatogram Analyses Compound Detection & Identification Compound-specific Isotope Ratio Mass Spectrometer Compound-specific Deuterium & Carbon isotope compositions Analytical Uncertainty: ±5‰
Arctic Paleocene-Eocene Thermal Maximum ~55.6 Ma Duration: ~150-200 kyrs Modified from Pagani et al., 2006
Arctic Eocene Thermal Maximum-2 ~54 Ma Duration: ~75-100 kyrs This work
Preliminary Conclusions • Enrichment at the onset for both events with different magnitudes • Decreased rainout for moisture reaching the poles • 15-20‰ magnitude depletions during the events • Similar variations during both the events
Preliminary Conclusions • Enrichment at the onset for both events with different magnitudes • Decreased rainout for moisture reaching the poles • 15-20‰ magnitude depletions during the events • Similar variations during both the events
Hypotheses • There is a systematic change in moisture transport to the higher latitudes during hyperthermal events • Are there similar changes in δD during the two hyperthermals at the higher latitudes? • Preliminary Conclusion: Enrichments in δD do correspond with the hyperthermals at the onset of the event with similar magnitude depletions during the event Number of samples Arctic ETM-2: 29 samples
Hypotheses • There is a systematic change in moisture transport to the higher latitudes during hyperthermal events • Are there similar changes in δD during the two hyperthermals at the higher latitudes? • Can these changes be detected on a global scale? • Can this theoretical model be reproduced with an isotope coupled climate model?
Summary of changes during PETM • Tropics • Tanzania – 15‰ enrichment • Colombia - ~30‰ depletion • Mid-latitudes • Lodo – No change during the event with hints of depletion at the onset and the end • Bighorn Basin – No significant change • Forada - ~10‰ enrichment at the onset followed by a10‰ depletion during the event • High Latitudes • Arctic – 60‰ enrichment at the onset followed by 20‰ depletion through the event
Summary of changes during PETM • Tropics • Tanzania – 15‰ enrichment • Columbia - ~30‰ depletion • Mid-latitudes • Lodo, California – No change during the event with hints of depletion at the onset and the end • Bighorn Basin – No significant change • Forada, Italy - ~10‰ enrichment at the onset followed by a10‰ depletion during the event • High Latitudes • Arctic – 60‰ enrichment at the onset followed by 20‰ depletion through the event
Summary of changes during PETM • Tropics • Tanzania – 15‰ enrichment • Columbia - ~30‰ depletion • Mid-latitudes • Lodo – No change during the event with hints of depletion at the onset and the end • Bighorn Basin – No significant change • Forada - ~10‰ enrichment at the onset followed by a10‰ depletion during the event • High Latitudes • Arctic – 60‰ enrichment at the onset followed by 20‰ depletion through the event
Hypotheses • There is a systematic change in moisture transport to the higher latitudes during hyperthermal events • Can these changes be detected on a global scale? • Preliminary Conclusion: Existing data not sufficient to draw conclusions about regional & hemispherical changes. Requires further studies on a global scale
Hypotheses • There is a systematic change in moisture transport to the higher latitudes during hyperthermal events • Are there similar changes in δD during the two hyperthermals at the higher latitudes? • Can these changes be detected on a global scale? • Can these changes predicted be reproduced with an isotope coupled climate model?
Future Work: Eocene Modeling • Goal • To utilize the global dataset developed to compare the hydrological response in terms of isotopes, temperatures and precipititation signals • Simulations planned • Hyperthemal scenarios (PETM vs. ETM2) • Different CO2 concentrations • Background Eocene
Thank You Acknowledgments Joint Oceanographic Institute, ODP/IODP Mark Pagani, Matt Huber, Appy Sluijs, Carlos Jaramillo Peter Douglas, Sitindra Dirganghi, Micheal Hren, Brett Tipple, Katie French, Keith Metzger, Courtney Warren, Matt Ramlow, Gerry Olack, Dominic Colosi Yale G&G Faculty, Staff & Students