Download
1 / 55
550 likes | 688 Vues
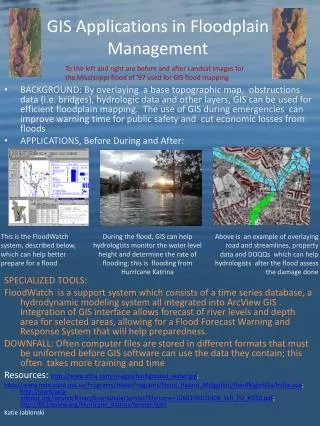
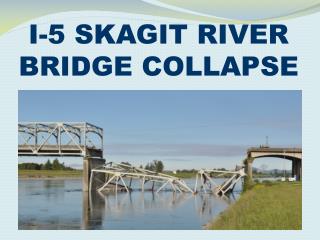
Impacts on Flooding in the skagit river Developing tools for better floodplain management. Joe Hamman October 16, 2012 Washington Cooperative Fish and Wildlife Research Unit Seminar Series Olympia, WA. Global climate change. Hamilton, WA 2007. Presentation Outline.

E N D
Impacts on Flooding in the skagit river Developing tools for better floodplain management Joe Hamman October 16, 2012 Washington Cooperative Fish and Wildlife Research Unit Seminar Series Olympia, WA
Global climate change Hamilton, WA 2007
Presentation Outline • Brief overview of current climate science • Implications of climate change for river flooding and sea level rise • Overview of the Skagit River Watershed and flood history • Climate change impacts on flooding in the Skagit River • Potential for risk reduction • Questions Aerial computer generated depiction of large flood event from Burlington to Mount Vernon to Padilla BayPicture Courtesy Skagit County Public Works Department
Global Climate ChangeThe basics 20th century warming between 0.75 and 1°C Source: IPCC, 2007
Global climate models Projections from GCMs 21th century warming between 1.5 and 3°C Source: IPCC, 2007
Future Climate Change in the Pacific Northwest • Mote et al. (2010) looked at the output from 20GCMs • Strong signal-to-noise ratio for changes in temperature • No clear signal for changes In precipitation • Temperature • 2020s – 1.1°C • 2040s – 1.8°C • 2080s – 3.0°C • Precipitation • +1% to +2% Source: Mote et al, 2010
Future Climate Change in the Pacific Northwest • Seasonal Temperature • Largest increases during Summer months • Seasonal Precipitation • Increase in Winter/Spring/Fall precipitation • Decrease in Summer precipitation Source: Mote et al, 2010
Implications of warming on hydrology Source: Alan Hamlet
Implications of warming on hydrology Source: Alan Hamlet
Reservoir Modeling • Satisfy system mass balance and physical constraints on storage and releases. • Satisfy local minimum flow requirements. • Satisfy hydropower production demands. • Follow flood control rules and mimic flood control operations.
Changes in Streamflow Timing • Changes due to warmer temperatures and increased Winter precipitation • Rain Dominant Basins: small increases • Transient Rain-Snow Basins: shift from spring peak to Fall/Winter peak • Snowmelt Dominant Basins: decrease in Spring/Summer flow Rain Dominant Chehalis River Transient Rain-Snow Yakima River Snowmelt Dominant Columbia River Source: Elsner et at., 2010
Changes in Monthly Average Streamflow Skagit River Basin near Mount Vernon 2080s 2040s Source: Lee & Hamlet, 2012 (In Preparation)
Changes in flooding Snow Mixed Rain Source: Tohver and Hamlet (2010)
Changes in 100-year Flood Statistics + 23% + 40% Baseline Condition 20 % 24 % • 100-year flood risks are reduced only 3 % for the 2040s and 1 % for the 2080s under the alternative flood control curves. • The alternative flood control operations are largely ineffective in mitigating the increased flood risks. Source: Lee & Hamlet, 2012
Global Sea level rise 3.26 mm/yr Source: IPCC, 2007
Puget Sound Sea Level Rise • Puget Sound SLR rate adjusted for vertical land movement is 1.8-2.2 mm/year. • Recent trends in Puget Sound MSL are smaller than 20year global average of 3.26 mm/year. VLM = -0.1 mm/year VLM = 1.2 mm/year VLM = 0.9 mm/year VLM = 4.0 mm/year
Global Sea Level Rise • Heterogeneous global SLR • Observed trends in Eastern Pacific sea level are negative over past 20 years • Likely due to large scale wind patterns • It is unclear how long this pattern will persist Sea-Level Trends from Satellite Altimetry, 1992 -2009 ≈2mm/yr Source: Nicholls and Cazenave, 2010
Projections of global Sea level rise Figure adapted from Nicholls and Cazenave (2010)
Storm SurgeLinear regression approach • Calculate anomalies and sort by month • Anomaly = f (Pressure, Pressure Patterns, ENSO) • Training Data: WRF-Reanalysis, observed ENSO • Forecast Data: WRF-ECHAM5 and ECHAM5 SSTs • Add forecasted anomalies and SLR to hourly tide projections
Storm SurgeEl Nino Southern Oscillation • Linear relationship between ENSO and Winter height anomaly • Extracted Nino3.4 from GCM SSTs
Storm SurgePressure patterns • Used singular value decomposition (SVD) to isolate important regional pressure patterns • These time series represent the key modes of pressure variability that explain storm surge anomalies
Storm Surge and SLR • No change in the storm surge CDFs between RCM time periods • SLR, by comparison, drastically changes the CDFs by shifting them each upward
The Skagit River reservoirs Ross Upper Baker Diablo Gorge Lower Baker The Baker River The Upper Skagit River Concrete Mount Vernon The Sauk River : Storage : Run of River Source: Se-Yeun Lee
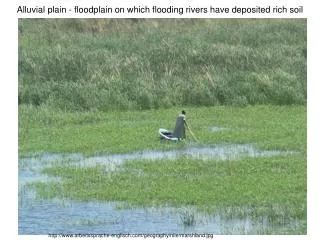
Lower Skagit River Basin Skagit River Basin
Flooding in the skagit river basin • Organizations involved: • US Army Corps of Engineers – Flood Control Operations • FEMA – Flood Mapping and Flood Insurance (NFIP) • Puget Sound Energy – Baker River Reservoirs • Seattle City Light – Skagit River Reservoirs • County and Local Governments – Coordination and Development
Local impacts • How do we combine what we know about flooding and SLR in the Skagit River to plan for the future? +
Methods100-year flood mapping • Applied relative changes in 100-year flood to FEMA hydrograph • Eliminates model bias in peak flows • Performed composite flood mapping for 2040s and 2080s (7 levee failure scenarios)
Scaled q100 FloodsAll levees intact Historical 2040s 2080s • Inputs: • Q100: Historical • SLR: 0.00 feet • Results: • Area: 42,266 acres • Avg. Depth: 4.5 ft. • Inputs: • Q100: 2040s (x1.14) • SLR: 1.35 feet • Results: • Area: 66,248 acres • (+57%) • Avg. Depth: 5.3 ft. • Inputs: • Q100: 2080s (x1.32) • SLR: 3.02 feet • Results: • Area: 73,594 acres • (+74%) • Avg. Depth: 5.7 ft.
3 Largest Floods in 2050sAll Levees intact Jan. 30, 2069 Feb. 4, 2063 Nov. 18, 2047 122% Inundation Relative to His Q100
Scaled Q100 FloodsComposite of 7 levee scenarios Historical 2040s 2080s • Inputs: • Q100: Historical • SLR: 0.00 feet • Results: • Area: 71,427 acres • Avg. Depth: 7.0 ft. • Inputs: • Q100: 2040s (x1.14) • SLR: 1.35 feet • Results: • Area: 72,206 acres • (+1%) • Avg. Depth: 7.5 ft. • Inputs: • Q100: 2080s (x1.32) • SLR: 3.02 feet • Results: • Area: 72,768 acres • (+2%) • Avg. Depth: 7.8 ft.
Scaled Q100 FloodsDifference from Historical 2040s 2080s +5 Inches +10 Inches
Natural River Conditions (Natural)
Constrained Channel Conditions (Natural) Existing Levees Q100- Historical
Constrained Channel Conditions (Natural) Existing Levees Q100- Future
Constrained Channel Conditions (Natural) Bigger Levees Q100- Future
Partially Constrained Conditions (Natural) Q100- Future
Right levees removed (Example) • 2080s • 1.32xHistorical • 75% area flooded relative to the “All Levees Intact” Scenario • Similar process could be completed for other levee removal and setback scenarios
Conclusions • Future storm surge, brought on by barometric and wind effects, is not expected to change significantly. • Sea level rise is expected to influence extreme water levels much more than changes in storm surge. • Inundation from flooding in the Skagit is expected to increase by up to 74% by the 2080s given combined SLR and increased flood magnitudes. • Average depth in flood map increases by • 5 inches in 2040s • 10 inches in 2080s • Using a scenario based approach is an effective way to understand changes in flood magnitudes over time. • Modifying levee positions is a way to offset the increases in flood risk.
Questions? Acknowledgments • Alan Hamlet • Contributors • Se-Yuen Lee • Matt Stumbaugh • Eric Salathé • Roger Fuller • Eric Grossman • Funding • US Environmental Protection Agency • The Nature Conservancy
2040s 100-year FloodAll levees intact • Inputs: • Hydrograph: 1.14 x (His 100yr) • Sea Level Rise: 1.35 feet • Area Flooded: 66,248 acres • (+57%)
2080s 100-year FloodAll levees intact • Inputs: • Hydrograph: 1.32 x (His 100yr) • Sea Level Rise: 3.02 feet • Area Flooded: 73,594 acres • (+74%)
resources • Skagit County HAZUS - http://www.skagitcounty.net/Common/asp/default.asp?d=PlanningAndPermit&c=General&p=FEMAfloodstudy/femafloodstudy2010.htm • Skagit County Flood Study – http://www.skagitcounty.net/Common/asp/default.asp?d=PlanningAndPermit&c=General&p=FEMAfloodstudy.htm • Envision Skagit 2060 - http://www.skagitcounty.net/Common/asp/default.asp?d=EnvisionSkagit&c=General&P=reports.htm • Climate Impacts Group, 2860 project - http://www.hydro.washington.edu/2860/
Dynamic Downscaling • WRF provides atmospheric conditions at much higher resolution • Simulates actual weather prescribed by large scale GCM • Produces actual storms • Does not rely on the historical time series • Three 30-year time periods • 1980s, 2020s and 2050s
Statistical Downscaling • Adjusts historic monthly timeseries to match CDF of GCM at each grid cell • Forces historic daily timeseries to fit new monthly values • Preserves most of the historical time series behavior • Storm size, storm location, interarrival, seasonality, time, etc. • Two30-year time periods • 2040s and 2080s