Download

1 / 10
170 likes | 787 Vues
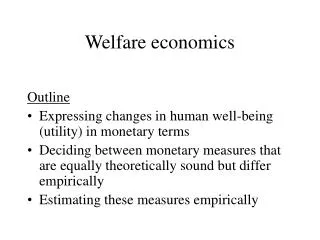
Welfare Economics. Chapter 7: Consumer Surplus. Welfare Economics. Welfare Economics is the study of whether a market allocation is socially desirable Market equilibrium maximizes total welfare for society unless there is a market failure (i.e. externalities, price fixing, etc…).

E N D
Welfare Economics Chapter 7:Consumer Surplus
Welfare Economics Welfare Economics is the study of whether a market allocation is socially desirable • Market equilibrium maximizestotal welfare for society unless there is a market failure (i.e. externalities, price fixing, etc…) S = Marginal Cost (MC) D = Marginal Benefit (MB) MB = MC so Total Welfare is maximized
Consumer surplus-measures welfare for the buyer Producer surplus-measures welfare for the seller Total Welfare =Consumer Surplus +Producer Surplus
CONSUMER SURPLUS • Willingness to pay-the maximum price a consumer would pay • how much a consumer values a good/service • called the marginal benefit (MB) • Consumer Surplus-buyer’s willingness to pay minus price paid • CS=MB –Price Paid
Consumers value goods differently The demand curve is essentially a marginal benefit curve Demand Schedule & the Demand Curve The market demand curve depicts the quantity buyers are willing to pay at each price
John ’ s willingness to pay $100 Paul ’ s willingness to pay 80 George ’ s willingness to pay 70 Ringo ’ s willingness to pay 50 Demand or Marginal Benefit Demand Curve Price of Album 0 1 2 3 4 Quantity of Albums
John ’ s consumer surplus ($30) Paul ’ s consumer surplus ($10) As Price ↓=> Consumer Surplus ↑ Total consumer surplus ($40) Demand Equilibrium Price = $70 Price of The area below the demand curve & above the price measures the consumer surplus in the market. Album $100 80 70 50 Quantity of 0 1 2 3 4 Albums
A This triangle represents the “welfare” of all consumers at a market price of $100 Consumer Total Consumer Surplus = $10 ½ * 1 * 20 = $10 [½ b * h] Surplus 100 B C D1 = MB1 20 Equilibrium Price & Consumer Surplus Price 200 Quantity 0
Consumer Surplus Handout • Please complete Consumer Surplus worksheet
A Sample Problem 1) Calculate the initial consumer surplus at equilibrium price of $300 Price 2) Calculate the changein consumer surplus when price falls to $100 500 3) After the price decreases from $300 to $100 a) what gain is for old consumers(people who also bought when price = $300) b) what gain in consumer surplus is for new consumers E1 300 ----------------- -------------------- E2 ---------------------------------- 100 ----- D1 50 100 Quantity 0