Download
1 / 14
140 likes | 225 Vues
The salinity signal of the shelf-deep ocean exchange in the SWA: Satellite observations. 1 Instituto Nacional de Investigacion y Desarrollo Pesquero, Argentina

E N D
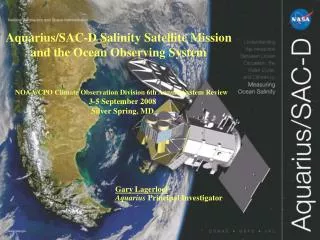
Thesalinitysignal of theshelf-deepoceanexchange in the SWA: Satelliteobservations 1 Instituto Nacional de Investigacion y Desarrollo Pesquero, Argentina 2 Servicio de Hidrografıa Naval and Departamento de Ciencias de la Atmosfera y los Oceanos, Universidad de Buenos Aires and UMI/IFAECI, CONICET, Argentina 3 College of Earth, Ocean and Atmospheric Sciences, Oregon State, USA 4 RemoteSensingSolutions, Inc., Pasadena, California 5oUniversity of California, Los Angeles, California, USA 6 Universidad Nacional del Sur and Instituto Argentino de Oceanografıa, Argentina 7 Departamento de Ciencias de la Atmosfera y los Oceanos, Universidad de Buenos Aires, and UMI/IFAECI, CONICET, Argentina Raul A. Guerrero1, Alberto R. Piola2,7, Harold Fenco1, Ricardo P. Matano3, Vincent Combes3, Yi Chao4,5, Corinne James3, Elbio D. Palma6, Martin Saraceno7, and P. Ted Strub3 9th Aquarius/SAC-D Sc. Meeting Seattle, USA Nov. 2014
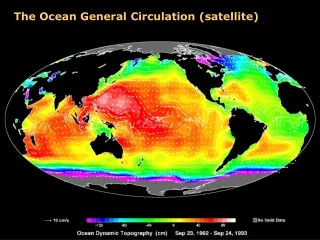
Mean SSS-Aquarius L3 (v2.0) -SSS from Aquarius shows the main ocean-basin features of the South Atlantic, already proven since the early results of the mission.
Stand.Deviation of SSS-Aquarius The export of shelf waters to the deep ocean near 35ºS creates the largest signal of SSS variability in the SA (south of the tropics).
SWA – Shelf / Deep-Ocean - SSSaq SWA – Shelf / Deep-Ocean – SSSin-situ PPW Plata PlumeWater SASW Subant. ShelfWater STSW Subtrop. ShelfWater Deepocean (>200m) upper 50m water
time scales weeks Spatialscales 100 km MESO-SCALE processes Remote SST Remote SSH Remote SSS • Kernel density estimator (K) • Gaussian function (k(z)) • Bandwidth = 0.75 (h) • L2 – weekly • SSS range: 20 38 • Grid size: 0.5 x 0..5 • Search Radius = 1° x 1° • Smoothing Factor = 0.001 A ChallengeforAquarius??? Griddingtechnique: Local polynomial (Lilly and lagerloef (2008) Individual polynomial adjustments every search radius; optimizing in its environment for a better representation of the local variation
3 WeeksWeightedMovingAverange (3WeMA) 50% (WEEK 2) 25% (WEEK 1) 25% (WEEK 3) 20-60-20% 15-70-15% In either case SEAM TO BE IMPROVEMENTS in the error levels
New L3 weeklyfor Dec11-2011 Aquarius (a) and SMOS (b) • LSW deepocean • Aquarius & SMOS • Cyclonic (C2; C3) • Anti-cyclinicrings (A1) • Validatedby: • Surfacecurr. (OSCAR) • SST (Modis) • Chla (modis)
Time serie 27Nov-2011 / 1Jan-2012Evolution of a Low SSS intrusionintothedeepoceanand tracking of warn-salty and cold-freshrings
SSS variabilityalongtracks(crossshelf break) Seasonal • Fresher • Spring-Summer • Salty • autumn and winter Intra-seasonal LSW detrainmentsintothedeepocean
Time series of SSSaq at central track • SSSAq and SMOS • Outershelf (point 3) • Slope (Point 4) Wind stress (Area “d”) c) ASCAT alongshelf (obs and 2008-13 daily mean). d) ASCAT WS anomaly (along.S.) e) Rio de la Plata discharge Seasonal SSS: Fresher Spring and summer SaltierAutumn and winter SSS < 33.5 crossingthe 200m - Mostlyspring-summer time - WhenWind stress reverse to SE - No obvios influencefromRdPdisch
Summer mean SSSaqanomaly and dynamictopographyanomaly LSW alongthe BMC Obs: Gordon 1989 Provost et al. 1996 Modelling: Palma et al. 2008 SSSaq and Smos LSW derives fromRdlP Drivenbythe BMC and occursmostly in late spring and summer. Location~ 37°S In agremmentwithnumericalsimulations (Matano et al., 2014)
Winter SSS fields and anomalies (Smos and Aquarius) • Weakerdetrainments in SSS: • Fewerevents • Underwindreversalcond. • NO RdlPdischargeinflu. Location: 27°S 35°Salso in agremmentwithnumericalsimulations(Matano et al., 2014) Still intense LowSalinity (< -.5) intothedeepocean (in contrasttoBrazilWater) resulting in a warmvariety of ShelfWaters(Gordon 1989; Piola et al., 2008)
Summary and Conclusions • Aquarius and SMOS SSS capture the detrainment of shelf waters into the deep ocean • The export of shelf waters near the RdlP causes the strongest salinity signal throughout the South Atlantic (south of 10°S) • Thedetrainments of low-salinity waters present a strong seasonal signal which is associated with the alongshore wind stress variabilityovertheshelf: Summer 36-37°S; Winter 27-35°S • The low-salinity waters cause an extensive negative salinity anomaly whose core follows the path of the BMC • The general agreement with the numerical simulations and in situ observations indicate an outstanding overall performance of the satellite-based salinity sensors

![The European North Atlantic shelf [Ocean-Shelf Exchange, internal waves]](https://cdn0.slideserve.com/118374/the-european-north-atlantic-shelf-ocean-shelf-exchange-internal-waves-dt.jpg)


![[PDF] DOWNLOAD Deep in the Ocean](https://cdn7.slideserve.com/12432122/slide1-dt.jpg)