Download
1 / 37
370 likes | 499 Vues
Change from Baseline Performance: Practice Level Considerations. Lynne S. Nemeth, PhD, RN. Steven M. Ornstein, MD (PI) Ruth G. Jenkins, PhD Paul Nietert, PhD Chris Feifer, DrPH Andrea M. Wessell, PharmD Heather A. Liszka, MD, MS. Practice Partner ™, Seattle, WA MUSC 100+ practices.

E N D
Change from Baseline Performance: Practice Level Considerations Lynne S. Nemeth, PhD, RN
Steven M. Ornstein, MD (PI) Ruth G. Jenkins, PhD Paul Nietert, PhD Chris Feifer, DrPH Andrea M. Wessell, PharmD Heather A. Liszka, MD, MS Practice Partner™, Seattle, WA MUSC 100+ practices A-TRIP Research TeamPractice Partner Research Network Funded by the Agency for Healthcare Research and Quality: U18 HS13716
Aims • Provide context for examining practice change in a primary care quality improvement intervention • Describe a composite measure of quality to evaluate change at the patient and practice level • Compare improvement patterns across practices: higher baseline performance vs. lower baseline performance
Accelerating Translation of Research into Practice (A-TRIP) • 4 year demonstration project • Funded under AHRQ Partnerships for Quality Initiative • Practice Partner Research Network (PPRNet) Collaborative • Expand PPRNet’s approach to QI 125 Primary Care Practices 85 Clinical Process and Outcome Measures
Specialty of PPRNet Practices Family Medicine 78% Internal Medicine 18% Multi-specialty primary care 4%
Clinicians in PPRNet Practices Physicians 462 Nurse Practitioners 63 Physician Assistants 51 Total 576
Distribution of PPRNet Pts/Practices PPRNet is representative of US population
85 Measures in 8 Clinical Domains • Diabetes Mellitus (13) • Heart Disease and Stroke (21) • Cancer Screening (12) • Adult Immunizations (14) • Respiratory Disease / Infectious Disease (6) • Mental Health / Substance Abuse (14) • Nutrition / Obesity (3) • Inappropriate Rx prescribing in the elderly (2)
PPRNet TRIP Intervention Methods • Practice Performance Reports • Practice Site Visits • Network Meetings © PPRNet, 2003-2006
Practice Performance Report • ~80 indicators* • SPC methodology • Time trends • PPRNet benchmark (ABC) • National benchmarks (where available) *http://www.musc.edu/PPRNet/ATRIP%20Sample%20Report/Sample%20Report.pdf
Patient-Level Report (PLR) • Quarterly report • Excel Spreadsheet: 1 patient per row • Same guideline criteria as practice report • All “active” patients ≥ 18 yo • Children: • Age 5-17: Asthma controller • ♀ age 16-25: Chlamydia screening
PPRNet TRIP QI Model Key Elements • Prioritize Performance • Involve All Staff • Redesign Delivery System • Activate the Patient • Use EMR Tools * Jt Comm J Qual & Safety, August2004, 30(8):432-441. © PPRNet, 2003
QI Activities • Research team visited practices 2x per yr • Guideline-based academic detailing • Review of practice reports • Participatory planning with clinicians and staff • Annual network-wide QI meeting • Updates by research team • Best practice presentations by practices • Small group workshops
Practice Improvement • Study Practice Report • Practices select indicators to target for improvement • Follow improvement over time • Use PLR to identify individual patients • Implement Quality Improvement Cycle
How to Rank Practice Performance • With many specific indicators to focus on, how can performance be evaluated across practices in a network or collaborative? • A summary measure might increase the relevance of improvement within practices over time • Hence, the SQUID was created
The SQUID: Algorithm • Define processes and outcomes of interest, regardless of target • BP Monitoring • LDL Monitoring • HgbA1C Monitoring • BP Control • LDL Control • HgbA1C Control 80 indicators reduced to 31 processes & 5 outcomes Nietert et al: Implementation Science 2007, 2:11 doi:10.1186/1748-5908-2-11
The SQUID: Algorithm • Create indicator variables (ei) that reflect whether pt is eligible for each process and outcome measure • PAP Test (Women > 18 yrs old) • CRC screening (Men & Women > 50 yrs old) • Create indicator variables (mi) that reflect whether pt has met target for a process/outcome, his/her demographics and/or morbidity • If pt has HTN, then BP should be < 140/90 • But if pt has DM, BP should be < 130/80
M E The SQUID: Algorithm • E = The number of measures for which the pt is eligible (denominator) = Σ ei • M = The number of eligible measures for which the pt has met his/her morbidity-specific target (numerator) = Σ mi • Create a pt-level SQUID = • Create a practice-level SQUID = average of all pt-level SQUIDs • Other SQUIDs can also be calculated: • Provider level • Domain-specific (e.g. DM, cancer, vaccinations)
The SQUID: Interpretation • A patient’s SQUID reflects the proportion of targets met for which he/she is eligible. • A practice’s SQUID reflects the average proportion of targets achieved by their patients.
SQUID=Summary Quality Index • ~80 indicators 36 measures Example • 30 year old ♀; no chronic disease eligible for 7 processes, 0 outcomes BP monitoring ✔ PAP Smear ✔ Total Cholesterol HDL Depression Screening Td vaccine ✔ Alcohol Screening • SQUID = 3 / 7 = 0.429
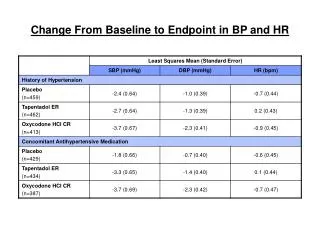
Final ATRIP Results: Change over time in the SQUID p < 0.0001 for trend over time (μ = +2.43% per year)
Correlation with Clinical Outcomes • SBP (r = -0.17) (DM and HTN pts only) • DBP (r = -0.23) (DM and HTN pts only) • LDL (r = -0.26) (DM and CHD pts only) • HDL (r = 0.17) (DM pts only) • Triglycerides (r = -0.16) (DM pts only) • A1C (r = -0.24) (DM pts only)
Does Baseline Performance Matter? • Post-hoc analyses focused on whether baseline performance significantly influenced the observed time trends. • Mixed linear regression models were used to examine the interaction between baseline strata (lower, middle, and upper tertiles) and time, adjusting for covariates including patient age and complexity.
Discussion • Practices with lower baseline performance made significant improvements over time (LDL control, HgbA1C control) • Practices prioritize areas of focus creating meaningful opportunities for improvement • Practices with higher performance at baseline may achieve increased rates of change, as they embed a model for improvement into practice patterns
Benefits of The SQUID Approach • Prior to using the SQUID, it was hard for practices to have a sense if their efforts were paying off (some indicators improved, some got worse). • Increasing SQUID scores seemed to provide them with some sense of success.
Limitations of This Approach • Quality indicators are weighted equally. • Some strong correlations among indicators • Total Cholesterol & HDL • LDL measurement & LDL control • Does not account for patient allergies or other contraindications to immunizations or medications
Strengths of This Approach • Direct interpretation, easily explained • Can be tailored for multiple levels of analysis • Can help clinicians quickly identify patients not at goals in their process of care
Issues for Further Consideration • Should process and outcome indicators be treated separately? • Should there be any adjustment for more “important” indicators? • Should there be any adjustment for more “difficult” indicators?
Conclusions • SQUID provides a useful composite measure with multiple quality indicators. • High performance at baseline may reflect increased exposure and experience with the PPRNet Model for Improvement • Lower performance at baseline, combined with an appreciation for performance data and a culture of learning might motivate achievement of significant improvement