Download
1 / 1
10 likes | 115 Vues
Drug Utilization. Dashboard Viability. Dashboard Candidates. Guidance Outcome Value. Medical Need. Pediatric Knowledgebase (PKB) -- A Hospital-based, Decision Support System to Guide Pharmacotherapy.

E N D
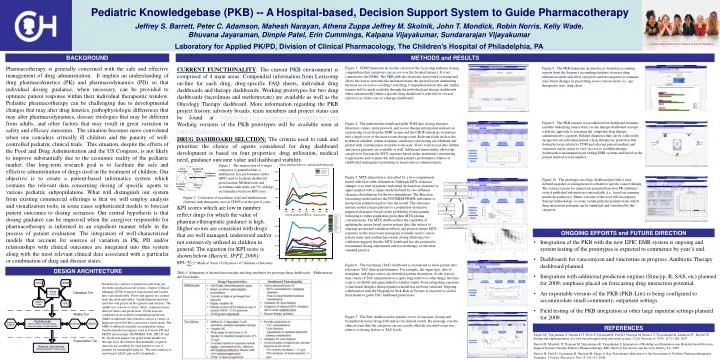
Drug Utilization Dashboard Viability Dashboard Candidates Guidance Outcome Value Medical Need Pediatric Knowledgebase (PKB) -- A Hospital-based, Decision Support System to Guide Pharmacotherapy Jeffrey S. Barrett, Peter C. Adamson, Mahesh Narayan, Athena Zuppa Jeffrey M. Skolnik, John T. Mondick, Robin Norris, Kelly Wade, Bhuvana Jayaraman, Dimple Patel, Erin Cummings, Kalpana Vijayakumar, Sundararajan Vijayakumar Laboratory for Applied PK/PD, Division of Clinical Pharmacology, The Children’s Hospital of Philadelphia, PA A Chair’s Initiative Project at the Children’s Hospital of Philadelphia METHODS and RESULTS Pharmacotherapy is generally concerned with the safe and effective management of drug administration. It implies an understanding of drug pharmacokinetics (PK) and pharmacodynamics (PD) so that individual dosing guidance, when necessary, can be provided to optimize patient response within their individual therapeutic window. Pediatric pharmacotherapy can be challenging due to developmental changes that may alter drug kinetics, pathophysiologic differences that may alter pharmacodynamics, disease etiologies that may be different from adults, and other factors that may result in great variation in safety and efficacy outcomes. The situation becomes more convoluted when one considers critically ill children and the paucity of well-controlled pediatric clinical trials. This situation, despite the efforts of the Food and Drug Administration and the US Congress, is not likely to improve substantially due to the economic reality of the pediatric market. Our long-term research goal is to facilitate the safe and effective administration of drugs used in the treatment of children. Our objective is to create a patient-based informatics system which contains the relevant data concerning dosing of specific agents to various pediatric subpopulations. What will distinguish our system from existing commercial offerings is that we will employ analysis and visualization tools, in some cases sophisticated models to forecast patient outcomes to dosing scenarios. Our central hypothesis is that dosing guidance can be improved when the caregiver responsible for pharmacotherapy is informed in an expedient manner while in the process of patient evaluation. The integration of well-characterized models that account for sources of variation in PK, PD and/or relationships with clinical outcomes are integrated into this system along with the most relevant clinical data associated with a particular or combination of drug and disease states. Figure 3. CHOP maintains an on-line version of the Lexicomp pediatric dosing compendium that caregivers can access over the hospital intranet. It is not connected to the EMRs. The PKB pulls the electronic data from Lexicomp and allows the user to structure the information into the desired layout eliminating the need for excessive scrolling / searching. Compendial data in this and similar formats will be made available through the individual and therapy dashboards either automatically (when a specific drug dashboard is selected) or via user selection (as in the case of a therapy dashboard). CURRENT FUNCTIONALITY: The current PKB environment is comprised of 4 main areas: Compendial information from Lexicomp on-line for each drug, drug-specific FAQ sheets, individual drug dashboards and therapy dashboards. Working prototypes for two drug dashboards (tacrolimus and methotrexate) are available as well as the Oncology Therapy dashboard. More information regarding the PKB project history, advisory boards, team members and project status can be found at http://stokes.chop.edu/programs/cpt/pkb/index.php. Working versions of the PKB prototypes will be available soon at http://Pkb.chop.edu. Figure 8. The PKB maintains an interface to hospital accounting reports from the Sieman’s accounting database to assess drug utilization trends and allow caregivers and investigators to examine time-based changes in prescribing across various strata (i.e, age, therapeutic area, drug class). Figure 9. The PKB ensures cross-talk between dashboard elements (and the underlying source data) via the therapy dashboard concept – a holistic approach to assessing the composite drug therapy administered to a patient. Related diagnoses that can be collectively assigned to an individual patient’s drug therapy are pooled so that dosing histories related to TDM and relevant patient markers and outcomes can be easier to view. Access to available therapy dashboards is maintained from exiting EMR systems and based on the patient medical record number. Figure 4. The methotrexate dashboard pulls TDM data, dosing histories, laboratory values, study protocol, and rescue therapy information indexed on each dosing event from the EMR system and the CHOP enterprise warehouse into a single view of the most recent dosing event. Relevant fields such as the hydration schedule, serum creatinine, and leucovorin dosing are tabulated and plotted with customization available to the user. Views to historical data (within and across patients) are available as well. Additional functionality allows the caregiver to forecast the MTX exposure based on the institution’s monitoring requirements and examine the individual patient’s performance relative to established nomogram’s pertaining to leucovorin co-administration. DRUG DASHBOARD SELCTION: The criteria used to rank and prioritize the choice of agents considered for drug dashboard development is based on four properties: drug utilization, medical need, guidance outcome value and dashboard viability. Figure 1. The intersection of 4 target categories is quantified into a multimetric key performance index (KPI) used to facilitate dashboard prioritization. Methotrexate and tacrolimus rank in the top 5% of drugs on formulary based on KPI score. Figure 5. MTX disposition is described by a two-compartment model with first-order elimination. Although MTX clearance changes over time in patients with renal dysfunction, clearance is approximated with a simple model defined by two different clearance distributions for the two populations. The Bayesian forecasting model utilizes the NONMEM PRIOR subroutine to incorporate population priors into the model. The clearance mixture model assigns patients to a population (normal or impaired clearance) based on the probability of that patient belonging to either population given their MTX plasma concentrations. The MTX dashboard has the capability of updating the priors based on new patient data (the subject of ongoing operational validation efforts) and projects future MTX exposure on the leucovorin nomogram normally used to assess patient status and confirm leucovorin dosing. Retrospective validation suggests that the MTX dashboard has the potential to recommend dosing adjustments and rescue therapy sooner than standard practice. Figure 10. The prototype oncology dashboard provides a user-defined snapshot of dosing histories related to specific cancer therapy. The system screens for interaction potential based on PK attributes even if published information is unavailable (i.e., based on common metabolic pathways). Future versions of this tool will incorporate Simcyp methodology to create virtual pediatric patients from which drug interaction potential can be simulated and visualized by the caregiver. Figure 2. Utilization of tacrolimus (top) and methotrexate (bottom) with therapeutic area at CHOP over the past 6 years. KPI scores which are low in number reflect drugs for which the value of pharmacotherapeutic guidance is high. Higher scores are consistent with drugs that are well managed, understood and/or not extensively utilized in children in general. The equation for KPI score is shown below (Barrett, JPPT, 2008): ONGOING EFFORTS and FUTURE DIRECTION • Integration of the PKB with the new EPIC EMR system is ongoing and system testing of the prototypes is expected to commence by year’s end. • Dashboards for vancomycin and vincristine in progress. Antibiotic Therapy dashboard planned. • Integration with additional prediction engines (Simcyp, R, SAS, etc) planned for 2009; emphasis placed on forecasting drug interaction potential. • An exportable version of the PKB (PKB-Lite) is being configured to accommodate small community, outpatient settings. • Field testing of the PKB integration at other large inpatient settings planned for 2009. Figure 6. The tacrolimus (TAC) dashboard is customized to show patient data relevant to TAC clinical performance. For example, the organ type, date of transplant, and donor source are identified patient descriptors. As the typical time course of TAC administration is quite long relative to other drugs, the time scale is scrollable and again linked to tabular output. Forecasting drug exposure is functional though a final population model has not been validated. Ongoing collaboration with the Hospital for Sick Kids in Toronto is expected to yield a final model to guide TAC dashboard predictions. Table 1. Alignment of desired functionality and drug attributes for prototype drug dashboards – Methotrexate and Tacrolimus Database tier consists of patient records from our electronic medical records system - Sunrise Clinical Manager (SCM) extracted, transformed and loaded into a relational table. Views and queries are created from the relational tables. A multidimensional data mart that will permit ad hoc queries and analysis. The middle tier consists of alerts, filters, summarizations, derived values and predictions. Predictions are conducted in an external computational platform (M&S workbench) that executes code in a variety of languages provided they can run in a batch mode. The M&S workbench currently accommodates many standard prediction engines used to forecast PK and PK/PD relationships (NONMEM, SAS, SPLUS and R). Prediction engines are gated in the middle tier through logic that ensures that minimally required data sets are available for each patient or sets of patients for meaningful analysis. The user interface is web-based (AJAX and web2.0 standards). Figure 7. The TAC dashboard also permits views of exposure, dosing and biomarker histories along with indices for clinical events. By mousing over the clinical event data the caregiver can see exactly what the recorded event was relative to dosing history or TAC levels. REFERENCES Zuppa AF, Vijayakumar S, Mondick JT, Pavlo P, Jayaraman B, Patel D, Narayan M, Boneva T, Vijayakumar K, Adamson PC, Barrett JS. Design and implementation of a web-based hospital drug utilization system. J Clin Pharmacol: 47(9): 1172-1180, 2007. Barrett JS, Mondick JT, Narayan M, Vijayakumar K, Vijayakumar S. Integration of Modeling and Simulation into Hospital-based Decision Support Systems Guiding Pediatric Pharmacotherapy. BMC Medical Informatics and Decision Making 8:6, 2008. Barrett JS, Patel D, Jayaraman B, Narayan M, Zuppa A. Key Performance Indicators for the Assessment of Pediatric Pharmacotherapeutic Guidance. J Pediatr Pharmacol Ther 13:141-155, 2008.