Download
1 / 19
190 likes | 303 Vues
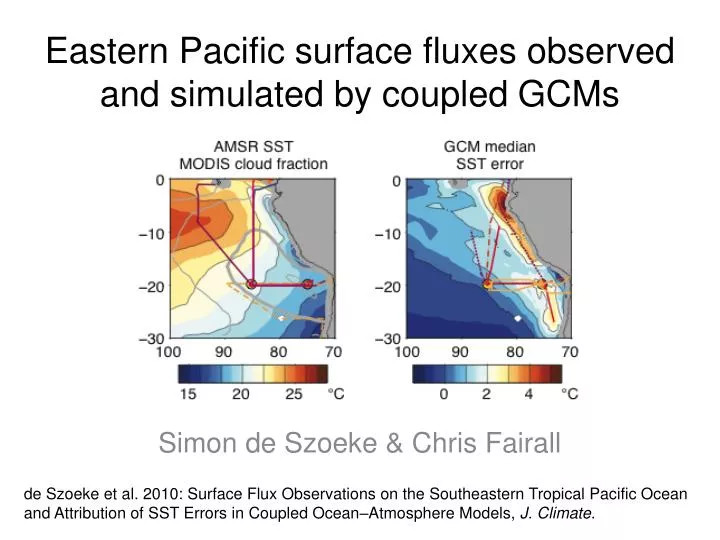
Eastern Pacific surface fluxes observed and simulated by coupled GCMs. Simon de Szoeke & Chris Fairall. de Szoeke et al. 2010: Surface Flux Observations on the Southeastern Tropical Pacific Ocean and Attribution of SST Errors in Coupled Ocean–Atmosphere Models, J. Climate. surface heat budget.

E N D
Eastern Pacific surface fluxes observedand simulated by coupled GCMs Simon de Szoeke & Chris Fairall de Szoeke et al. 2010: Surface Flux Observations on the Southeastern Tropical Pacific Ocean and Attribution of SST Errors in Coupled Ocean–Atmosphere Models, J. Climate.
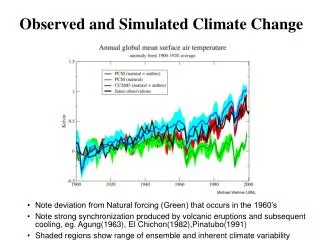
surface heat budget 0 = –∂/∂tSST turbulent evaporation and sensible flux net radiation ocean residual
annual average heat budget + + = 0
Ocean residual flux “observed” coupled GCM simulations
surface ocean heat budget October Colbo and Weller 2007
ship-observedheat fluxes 20°S, October
surface heat budget ΔS > 40 W m-2 obs.
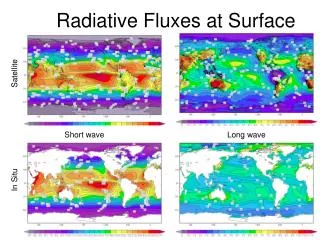
surface downwelling radiation solar longwave clear W m-2 full longitude S0:Iqbal 1988 R0: Hare 2005
surface downwelling radiation longwave solar W m-2 longitude
solar transmission clear full cloudy
longwave cloud effect 10 minute averages
Cloud forcing phase diagram polar cold dry column low sun tropical warm moistcolumn, high sun
Cloud forcing phase diagram 2(R–R0) > |S–S0| + 10 W m-2
Daily average cloud radiative forcing longwave solar xx: solar-weighted cloud fraction red: 2(R–R0) > |S–S0| + 10 W m-2
model surface cloud forcing models buoy ship ISCCP
surface heat budget 0 = –∂/∂tSST turbulent evaporation and sensible flux net radiation ocean residual = Ekman transport geostrophic transport upwelling eddy flux divergence damp SST
the end ?