Download
1 / 24
240 likes | 357 Vues
Incorporating risk metrics into food safety regulations: L. monocytogenes in ready-to-eat deli meats. Using Quantitative Risk Assessment and Accounting for Variability and Uncertainty . Daniel Gallagher Virginia Tech. 12th Annual Joint Fera /JIFSAN Symposium Greenbelt, MD

E N D
Incorporating risk metrics into food safety regulations: L. monocytogenes in ready-to-eat deli meats Using Quantitative Risk Assessment and Accounting for Variability and Uncertainty Daniel Gallagher Virginia Tech 12th Annual Joint Fera/JIFSAN Symposium Greenbelt, MD June 15-17, 2011
Traditional Regulatory Controls • Examples • Poultry cooked to minimum of 165°F • Milk pasteurized at 72°C for 15 sec • Food code safety criteria Aw < 0.95 & pH < 5.5 • L. monocytogenes zero tolerance (sampling: < 1 cfu / 25 g) • Major components in HACCP plans • Critical control points • Not directly related to public health / illness rate • Inflexible, not conductive to innovation Adapted from Buchanan & Whiting, CFSAN/FDA 2004
New Risk Based MetricsVocabulary • Appropriate Level of Protection (ALOP) • The level of protection deemed appropriate to protect health • Food Safety Objective (FSO) • The maximum frequency and/or concentration of a hazard in a food at the time of consumption that provides or contributes to the appropriate level of protection (ALOP) • Performance Objective (PO) • The maximum frequency and/or concentration of a hazard in a food at a specified step in the food chain before the time of consumption that provides or contributes to a FSO or ALOP, as applicable
Application of RM Metricsto a Food Process Pathogen Level Current risk PO ALOP Time Point of consumption Enter slaughter
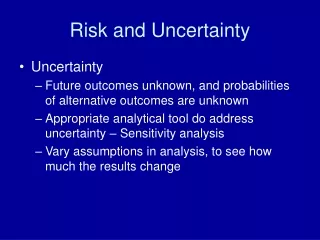
Different approaches • Traditional approach incorporates variability and uncertainty at each step of the process. The resulting estimated number of illnesses is an uncertain distribution. • The risk metric approach considers the number of illnesses as a fixed goal. • This research: incorporate uncertainty and variability into the performance objective (PO) at the plant, i.e. the PO is an uncertainty distribution.
Brief overview: risk metrics Food processing plant Retail grocery store Consumption in the home Listeriosis illnesses ALOP as fixed goal PO Regulated concentration PO Regulated concentration FSO dose ALOP Risk per serving
Implementation • Written in R 2.13 • snow package for parallel processing • Latin Hypercube design for selecting uncertainty realizations • Each run: 240 uncertainty simulations each with 7.5 million variability realizations
Major Data Sources • Plant Lm concentration distribution: FSIS reporting • Growth, lag times, plant-to-retail transport: Pradhanet al. 2009 • Transport times/temperature, lag times, growth rates (with & without growth inhibitors) • Retail Cross contamination : Endrikat et al. 2010 • Simplified z-score approach • Consumer handling: Pouillot et al. 2010 • storage time / temperature varies by retail vs plant sliced • Dose-response: WHO/FAO
Baseline Conditions • Uncertainty • Starting plant concentration distribution • Log10 normal distribution • mean: -9.22, SD: 2.92 • correlation: -0.99 • Fraction of product with growth inhibitor (50-60%) • Variability • Growth rates • Lag times • Storage times / temperatures • Serving sizes • Nonstochastic • Dose response r
WHO / FAO Dose Response Baseline: r fixed rhealthy= 2.41e-14 rsusceptible= 1.05e-12
Variability and Uncertainty2nd order Monte Carlo variability run for given uncertainty realization Uncertainty distribution of given statistic of each variability run Multiple variability runs for different uncertainty realizations
Example Result Retail sliced without growth inhibitor Max growth level 1:1 line no growth Cross contamination Results of 1 uncertainty run. N = 1e5 ALOP = -6.5 Truncated industry response PO
Root finding for Plant POEach uncertainty run Objective Function Resulting Plant PO for Target ALOP
Plant PO ResultsTruncated Industry Target ALOP
Deconvolution VerificationTruncated industry response. Target ALOP of log10 risk per serving = -6.416 (Q25 of the ALOP distribution). Based on a target ALOP and industry response, an uncertainty distribution for the PO was calculated. Different quantiles of this PO distribution were then set as the regulatory PO and the resulting uncertainty distribution of risk per serving generated.
For a fixed ALOP, different industry response assumptions lead to different POs Plant Lm Distribution
Plant PO results by industry responseTarget ALOP = -6.38 (Q50)
Incorporating Dose-Response UncertaintyTruncated industry response
Conclusions • Incorporating uncertainty into risk metrics is technically feasible • computationally intensive • much greater technical demands on risk managers • with uncertainty, adapting PO to actual regulations difficult • industry-wide compliance, not individual food plant • need to monitor for entire distribution • extremely broad PO uncertainty distributions • In practice, current levels of uncertainties limit applicability for L. monocytogenes
Acknowledgements • Funding: FSIS Project AG-3A94-P-08-0148 • Co authors at FSIS and Virginia Tech • Eric Ebel, Owen Gallagher, David LaBarre, Michael Williams, Neal Golden, Janell Kause, Kerry Dearfield • Régis Pouillot for assistance with dose-response modeling.