Download
1 / 24
240 likes | 326 Vues
Response of Lena basin river runoff to recent and projected global climate warming Georgiadi A.G., Milyukova I.P., Kashutina E.A. Institute of Geography, Russian Academy of Sciences, Staromonetny lane, 29, 119017 Moscow, Russia.

E N D
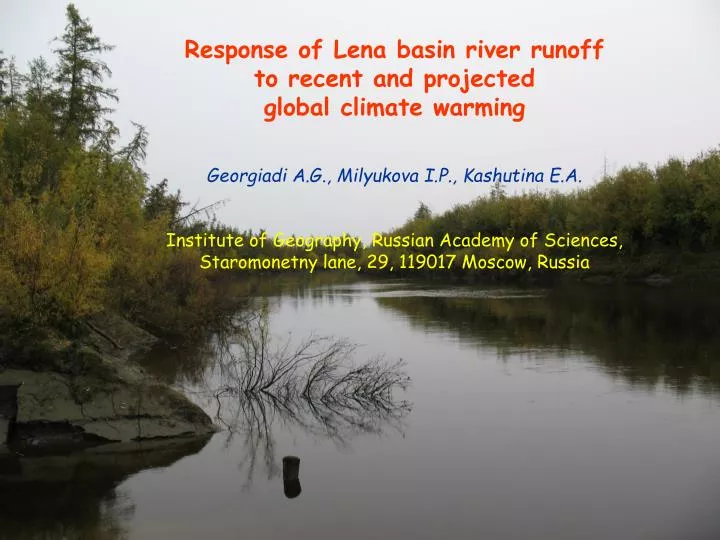
Response of Lena basin river runoff to recent and projected global climate warming Georgiadi A.G., Milyukova I.P., Kashutina E.A. Institute of Geography, Russian Academy of Sciences, Staromonetny lane, 29, 119017 Moscow, Russia
The main objectives of this investigation is to analyze the recent river runoff changes over the Lena River basin, as well as to compute river runoff changes caused by the projected global climate warming.
The Lena River basin in Eastern Siberia was selected as the main subject of investigation. It is one of the world’s largest basins that occupies the area of 2,488,000 km2 and extends as far as 4400 km. The basin is almost completely covered with deep permafrost ground whose upper active layer thaw out during a short summer season. In addition, the Lena basin is characterized by a small anthropogenic influence owing to a low population density. Analysis of the Lena basin is also facilitated by large intensive research programs carried out by Russian, bilateral, and international teams in the last 15 years.
Seasonal thawing (active layer) and freezing layers (red color), m (Fedorov et al.)
Table 1. Deviations of annual and seasonal precipitation (ΔP, mm) and air temperatures (ΔT, degrees of C), which are averaged for the period 1981-2005, from the appropriate values of the climatic characteristic considered, which are averaged over the period 1935-1980
Curves of cumulative sum of normalized values for annual and seasonal air temperature (T) for 1935-2004. 1 is the annual T; 2 is T for the winter (November-December); 3 is T for the flood (May-June) period; 4 is T for July-Octoberperiod. а – Vilyuisk, б – Vitim, в – Yakuts, г - Kyusyur
Deviations (in percent)of mean annual and seasonal runoff for the period 1981-2005 and the period from the start of observations to 1980. Designations of diagram columns: 1 is the annual runoff; 2 is the winter (November-December) runoff; 3 is the flood (May-June); 4 is the low water (July-October). 1) Lena, Krestovsky; 2) Lena, Kyusyur; 3) Markha, Malyukai; 4) Vilyui, Khatyryk-Khomo; 5) Vitim, Bodaibo; 6) Olekma, Kudu Kuel; 7) Uchur, Chyul’byu; 9) Aldan, Okhotsky Perevoz; 10) Amga, Buyaga
Deviations of annual and seasonal river runoff for Lena river and its major tributaries, which are averaged for the period R2 (1981-2005), from the appropriate values of the climatic characteristic considered, which are averaged over the period R1 (1935-1980)
Changes of annual and seasonal river runoff for major parts of Lena river basin (look at above mentioned table) Lena, Kyusyur 2488 sq. km 523/543 cub. km Vilyui 452 sq. km 45/52 cub. km Aldan 696 sq. km 166/176 cub. km Lena, Tabaga 897 sq. km 218/234 cub. km
Curves of cumulative sum of normalized values for annual and seasonal annual and seasonal river runoff for 1935-2005 1-year, 2- winter, 3-flood period, 4-summer-automn а – Vitim, Bodaibo, б – Lena, Kyusyur, в – Lena, Solyanka, г – Vilyui, Khatyryk-Khomo
PROJECTED RIVER RUNOFF CHANGES in first third of XXI (for central plain part of Lena river basin)
For water balance calculations in the Lena river basin a number of model blocks has been modified for the conditions of perennial frozen ground, as also blocks for calculations of seasonal soil grounds thawing have been arranged (Pavlov, 1979; Belchikov & Koren, 1979). In this version of model two essentially different procedures are used: one of them allows to estimate the dynamics of seasonal thawing - freezing of an active layer and, accordingly, other procedure, used for areas where there is no perennial frozen ground, allows to calculate the dynamics of seasonally frozen layer depth and its influence on the flow formation. The model parameters were optimized by the H. Rosenbrok optimization procedure (Rosenbrock & Story, 1968). The parameters were partly selected in an empirical manner.
The model is based on a conservation equation of average long-term monthly water balance of river catchments. In general it can be written down for each cell of a regular grid in the following way: where Qs (t) is the total surface and subsurface (seasonal active layer) flow (mm); Qgr (t) is groundwater flow (mm). The sum of Qs (t) and Qgr (t) makes a full river runoff. P (t) is atmospheric precipitation (mm); E (t) is evaporation (mm); Id (t) is infiltration of water to deep horizons of underground water outside of active water exchange zone (mm), dW/dt is change of water amount in active water exchange zone of the river basin for the time interval dt.
Central plain part of Lena river basin
As the climate scenario is used a range of possible climate change, which is calculated based on the results of numerical estimates for deviations of climatic elements from their recent values carried out on ensemble of 10 global climate models, originating from two contrasting scenarios of globally averaged air temperature changes (A2 and B1) included in the program of last experiment 20C3M-20th Century Climate in Coupled Models (Meehl et al., 2007), held in the framework of the Intergovernmental Panel on Climate Change (IPCC) and selected on the basis of comparison of observed and model present-day climate (Kislov et al., 2008).
Method for assimilation of climatic scenario modeling based on GIS
Deviations of mean monthly values for air temperature (dT, ° C) and precipitation (dP, mm) for the conditions of climate warming in 2010-2039from their present values, averaged over the cells of a regular grid covering the central plain part of Lena river basin.
Observed and projected (ensemble mean) river runoff hydrographs, averaged over the cells of a regular grid covering the central plain part of Lena river basin for the conditions of climate warming in the period 2010-2039
CONCLUSIONS 1.Significant and very inhomogeneous over Lena river basin air temperature increase was observed since 1980, which is most noticeable in winter as well in central and southern parts of the basin. Precipitation changes are characterized by different sign and magnitude that usually is not more than several percent in comparing with period from start of observations till 1980. 2.Since 1980, at Lena river outlet long-term mean annual, winter river runoff and river runoff for spring-summer flood were increased, whereas in summer-autumn low flow period it was very slightly decreased. 3.The obtained scenario estimates show that in case of realization of the most contrasting climatic scenarios A2 and B1 in the first third of this century in central plain part of Lena river basin, the most likely will be occuredinsignificant increase for annual river runoff (not more than 3-4%) in comparing with observed one. However, climate warming may cause some transformation of seasonal moovementfor river runoffwith small redistribution of river runoff during floods, which peaks shift to earlier dates. Under both scenarios slight decrease of maximum monthly river runoff during the flood is possible.