Download
1 / 80
800 likes | 950 Vues
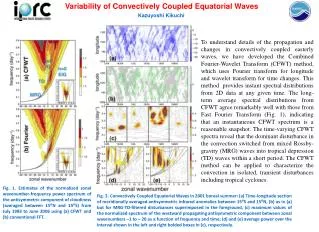
Detection of Equatorial Waves in Data. OLR power spectrum, 1979–2001 (Symmetric). from Wheeler and Kiladis, 1999. Space-Time Spectrum of JJA Symmetric OLR, 15 S-15 N. Kelvin. “TD” band. MJO. Eq. Rossby. Wheeler and Kiladis, 1999.

E N D
OLR power spectrum, 1979–2001 (Symmetric) from Wheeler and Kiladis, 1999
Space-Time Spectrum of JJA Symmetric OLR, 15S-15N Kelvin “TD” band MJO Eq. Rossby Wheeler and Kiladis, 1999
Space-Time Spectrum of JJA Antisymmetric OLR, 15S-15N Inertio- Gravity “TD” band MJO Wheeler and Kiladis, 1999
Space-Time Spectrum of JJA Antisymmetric OLR, 15S-15N Wheeler and Kiladis, 1999
Temperature Structure of a Dry Kelvin Wave Direction of Motion W C W C
Temperature Structure of a Dry Kelvin Wave Direction of Motion W C W C
Temperature at Majuro (7N, 171E) Regressed against Kelvin-filtered OLR (scaled -40 W m2) for 1979-1999 OLR (top, Wm-2) Temperature (contours, .1 °C), red positive from Straub and Kiladis 2002
Temperature at Majuro (7N, 171E) Regressed against Kelvin-filtered OLR (scaled -40 W m2) for 1979-1999 Wave Motion OLR (top, Wm-2) Temperature (contours, .1 °C), red positive from Straub and Kiladis 2002
Linear Theory Predicts: where is the vertical wavenumber is the equivalent depth is the vertical wavelength is the scale height
Using Representative Numbers for the Tropical Stratosphere: “Peak Projection Response” for h=200 m, c=45 m/s, Lz=12.0 km
Using Representative Numbers for the Tropical Stratosphere: “Peak Projection Response” for h=200 m, c=45 m/s, Lz=12.0 km Convectively coupled Kelvin for h=30 m, c=15 m/s, Lz=4.0 km
Using Representative Numbers for the Tropical Stratosphere: “Peak Projection Response” for h=200 m, c=45 m/s, Lz=12.0 km Convectively coupled Kelvin for h=30 m, c=15 m/s, Lz=4.0 km for c=5 m/s, Lz=1.2 km MJO
Zonal Wind at Majuro (7N, 171E) Regressed against Kelvin-filtered OLR (scaled -40 W m2) for 1979-1999 OLR (top, Wm-2) Zonal Wind (contours, .25 ms-1), red positive from Straub and Kiladis 2002
Temperature at Majuro (7N, 171E) Regressed against Kelvin-filtered OLR (scaled -40 W m2) for 1979-1999 Wave Motion OLR (top, Wm-2) Temperature (contours, .1 °C), red positive from Straub and Kiladis 2002
Specific Humidity at Majuro (7N, 171E) Regressed against Kelvin-filtered OLR (scaled -40 W m2) for 1979-1999 Wave Motion OLR (top, Wm-2) Specific Humidity (contours, 1 X 10⁻¹ g kg-1), red positive from Straub and Kiladis 2002
TOGA COARE Temperature (2S, 155E) Regressed against Westward Inertio Gravity-filtered OLR (scaled -40 W m2) Wave Motion Temperature (contours, .1 °C), red positive Haertel and Kiladis 2004
TOGA COARE Specific Humidity (2S, 155E) Regressed against Westward Inertio Gravity-filtered OLR (scaled -40 W m2) Wave Motion Specific Humidity (contours, 1 X 10⁻¹ g kg-1), red + Haertel and Kiladis 2004
OLR and 850 hPa Flow Regressed against MJO-filtered OLR (scaled -40 W m2) at eq, 155E, 1979-1993 Day 0 Streamfunction (contours 4 X 10⁵ m2 s-1) Wind (vectors, largest around 2 ms-1) OLR (shading starts at +/- 6 W s-2), negative blue from Kiladis et al. 2005
OLR and 850 hPa Flow Regressed against MJO-filtered OLR (scaled -40 W m2) at eq, 155E, 1979-1993 Day-16 Streamfunction (contours 4 X 10⁵ m2 s-1) Wind (vectors, largest around 2 ms-1) OLR (shading starts at +/- 6 W s-2), negative blue
OLR and 850 hPa Flow Regressed against MJO-filtered OLR (scaled -40 W m2) at eq, 155E, 1979-1993 Day-12 Streamfunction (contours 4 X 10⁵ m2 s-1) Wind (vectors, largest around 2 ms-1) OLR (shading starts at +/- 6 W s-2), negative blue
OLR and 850 hPa Flow Regressed against MJO-filtered OLR (scaled -40 W m2) at eq, 155E, 1979-1993 Day-8 Streamfunction (contours 4 X 10⁵ m2 s-1) Wind (vectors, largest around 2 ms-1) OLR (shading starts at +/- 6 W s-2), negative blue
OLR and 850 hPa Flow Regressed against MJO-filtered OLR (scaled -40 W m2) at eq, 155E, 1979-1993 Day-4 Streamfunction (contours 4 X 10⁵ m2 s-1) Wind (vectors, largest around 2 ms-1) OLR (shading starts at +/- 6 W s-2), negative blue
OLR and 850 hPa Flow Regressed against MJO-filtered OLR (scaled -40 W m2) at eq, 155E, 1979-1993 Day 0 Streamfunction (contours 4 X 10⁵ m2 s-1) Wind (vectors, largest around 2 ms-1) OLR (shading starts at +/- 6 W s-2), negative blue
OLR and 850 hPa Flow Regressed against MJO-filtered OLR (scaled -40 W m2) at eq, 155E, 1979-1993 Day+4 Streamfunction (contours 4 X 10⁵ m2 s-1) Wind (vectors, largest around 2 ms-1) OLR (shading starts at +/- 6 W s-2), negative blue
OLR and 850 hPa Flow Regressed against MJO-filtered OLR (scaled -40 W m2) at eq, 155E, 1979-1993 Day+8 Streamfunction (contours 4 X 10⁵ m2 s-1) Wind (vectors, largest around 2 ms-1) OLR (shading starts at +/- 6 W s-2), negative blue
OLR and 850 hPa Flow Regressed against MJO-filtered OLR (scaled -40 W m2) at eq, 155E, 1979-1993 Day+12 Streamfunction (contours 4 X 10⁵ m2 s-1) Wind (vectors, largest around 2 ms-1) OLR (shading starts at +/- 6 W s-2), negative blue
Zonal Wind at Honiara (10S, 160E) Regressed against MJO-filtered OLR (scaled -40 W m2) for 1979-1999 OLR Pressure (hPa) Wave Motion OLR (top, Wm-2) U Wind (contours, .5 ms-1), red positive from Kiladis et al. 2005
Temperature at Honiara (10S, 160.0E) Regressed against MJO-filtered OLR (scaled -40 W m2) for 1979-1999 OLR Pressure (hPa) Wave Motion OLR (top, Wm-2) Temperature (contours, .1 °C), red positive from Kiladis et al. 2005
Specific Humidity at Truk (7.5N, 152.5E) Regressed against MJO-filtered OLR (scaled -40 W m2) for 1979-1999 OLR Pressure (hPa) Wave Motion OLR (top, Wm-2) Specific Humidity (contours, 1 X 10⁻¹ g kg-1), red positive from Kiladis et al. 2005
Lag-height regressions of OSA specific humidity vs. moisture budget-derived rainrate. The data are progressively regridded to coarser time intervals ((a) 6 h, (b) 1 day, and (c) 4 days), and a light high-pass filter is used for each panel (cutoff period six times the lag window width). (d) The original unfiltered 6 h data are used, with a very wide lag window. Contour unit is 0.1 g/kg per mm/h. from Mapes et al. 2006
Conclusion 1: Large scale atmospheric waves modulate waves and convection (along with the diurnal cycle) on smaller scales Conclusion 2: A portion of tropical convective activity is organized by equatorially trapped waves of Matsuno’s shallow water theory