Download
1 / 34
340 likes | 450 Vues
On the estimation of emissions from earth observation data. M. Schaap, R. Timmermans, H. Denier van der Gon, H. Eskes, D. Swart, P. Builtjes. Experiences from TNO using the LOTOS-EUROS model. TNO has a large experience in emission inventories.

E N D
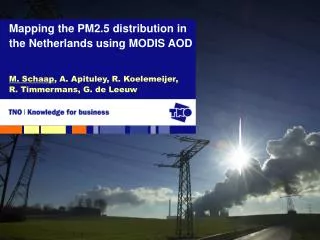
On the estimation of emissions from earth observation data M. Schaap, R. Timmermans, H. Denier van der Gon, H. Eskes, D. Swart, P. Builtjes Experiences from TNO using the LOTOS-EUROS model TNO experience
TNO has a large experience in emission inventories • Emission inventories on global, European and national scale • Top-down and bottom-up • Much attention for spatial distribution • Delivered emissions to e.g. GEMS, MACC, EUCAARI, MEGAPOLI TNO experience
Emissions of Elemental Carbon in Europe How can satellite data help to improve these maps? TNO experience
Natural & Biogenic emissions – calculated online Isoprene Marine emissions How can satellite data help to improve these algorithms? TNO experience
Research aims at TNO i.r.t. Earth Observation • To combine earth observation data and modelling to obtain an optimal assessment of the air quality over Europe. • To quantify anthropogenic emission strengths by using EO data. • Reanalysis as well as NRT Groundbased Model Satellite TNO experience
Numerical formulation Explicit CTM Input data Transport Advection Turbulence Gidded hourly simulated concentrations: Gases O3 , NO2 , SO2 … AerosolsSulfate, Nitrate, sec. organic, primary… Wet, dry deposition fluxes Emissions Regional / Local Preprocessing Chemistry Gas phase Aerosol Land use Deposition Wet and Dry Meteorological forecast ECMWF Global chemical forcing climatology / explicit model LOTOS-EUROS • CTM directed at the lower troposphere (up to 5 Km) • Developed at TNO & RIVM • Used at KNMI, PBL, Univ. Berlin, Univ. Aveiro • Includes a data assimilation environment
Meteorology Emissons Chemistry Instantaneous Emissions Advection Aerosol physics 24Hr Data Land use Vertical exchange Dry Deposition Satellite data Boundary conditions Wet Deposition … NO2 PM O3 AOD … Chemistry transport model Observations Input EnKF filter EnKF smoother Data-assimilation Schematic of LOTOS-EUROS modelling system: TNO experience
Model input Meteorology Emissions Noise Model Model A priory State integration integration Observations Satellite data In-situ data Assimilation Procedure EnKF Analysed State Concentrations Emissions Other parameters Output L4 data products Emission estimates Assimilation Analysed Observations procedure State ( x ) a Weather forecast Model integration Air Quality forecast Integration of earth observation data into models TNO experience
Single component assimilation – Ozone Ozone measurements from the EMEP network assimilated TNO experience
Validation Vredepeel Assimilation station Westmaas Validation station TNO experience
Single component assimilation – PM10 With assimilation Without assimilation From Denby et al. 2008, Atmospheric environment 42 TNO experience
The big challenges: • To disentangle the uncertainty due to the emission input from other model uncertainties • The assimilation “blames” all errors to a limited amount of parameters • To keep the system realistic and balanced • To combine different sources of data – multi component TNO experience
Assimilation of SO2 and SO4 – a case study SO2 SO4 Annual mean for 2003 TNO experience
Modelled annual mean concentrationsSO2 and SO4 TNO experience
Results: SO2 annual cycle over all assimilation stations TNO experience
Results: SO2 & SO4 annual cycle over all stations by including uncertain conversion rates SO2 SO4 TNO experience
Annual mean estimated multiplication factors Emissions Reaction rate Also after acknowledging the shortcomings of the model it indicates that the shipping emissions and those in Poland may be too high TNO experience
Assimilation OMI NO2 measurements with LOTOS-EUROS Impact for ozone at the surface Analysis NOx emissions / inventory (yellow=1) TNO experience
Impact of assimilation on ozone peak value Assimilation Surface ozone Assimilation OMI NO2 No assimilation NO2 bias in the model effects ozone negatively Note, OMI NO2 may be ~25% high TNO experience
Probability AERONET AOD - model To use AOD for estimating PM concentrations and emissions Bias determination PM & AOD Daily average AOD over all stations AODaeronet = 1.6 * AODmodel Modeled AOD PM10 = 2 * PM10model AERONET AOD all data TNO experience
Assimilation strategy • 2006 • LOTOS-EUROS CTM • Bias corr.: AOD = AOD * 1.6 • Reduced domain • MODIS data • Uncertainty: 0.05 + 0.15AOD • All pixels used • EnKF Assimilation • Model uncertainty relative to anthropogenic emissions • 30%, Daily, time correlation of three days • 12 ensemble members • Model simulation at overpass time stored during the day • Assimilation performed once a day at midnight • Localisation (ρ = 50 Km) AERONET EMEP TNO experience
Model to MODIS comparison MODIS composite Modelled composite TNO experience
Effect of Assimilation MODIS composite After assimilation TNO experience
Impact of assimilation on comparison with MODIS RMSE Cor TNO experience
Verification with AERONET 1 Correlation Assimilation 0 1 Model RMSE Assimilation Model TNO experience
Correlation PM10 measurements Assimilation Model RMSE Assimilation TNO experience Model
May 6th May 7th MODIS Assimilation Model TNO experience
Hamburg 2 1 TNO experience
Neuglobsow AOD PM10 TNO experience
Exploring the impact of forest fire emissions (FMI) on calculated PM fields: May 6th, 2006 LOTOS-EUROS PM TNO experience
Conclusions • To quantify emissions from observations one needs a model • Data assimilation or inverse modelling of EO data is feasible • We are able to provide level 4 products • Data assimilation an objective framework • To estimate emissions challenges are: • To disentangle the uncertainty due to the emission input from other model uncertainties • To keep the system realistic and balanced • To combine different sources of data – multi component • Hence, this is a long term scientific research line TNO experience
Where can we use our present capabilities to provide information on emissions? • Search for trends in the parameter estimates? • Does the EO data indicate that the emission trend is not as expected? • The system does the meteo correction, etc for you. • To indentify locations of new and significant emission sources • The areas with consistently high model-measurement deviations • To identify time profiles – needed: geostationary data • Emission estimates • Only in hotspot locations, and/or with observations during the emission itself. • Direct variables such as land use, LAI, Fire Radiative Power, White cap, etc TNO experience
Assimilation stations TNO experience
Validation stations TNO experience