Download
1 / 20
210 likes | 427 Vues
Methodology for MALDI PTM application. One of the application of MALDI is for the determination of the post translation modification of the protein, which can be done by interpretation of c n ions signals in the mass spectrum . Related Los: Laser properties, Matrix properties

E N D
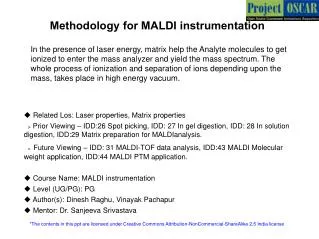
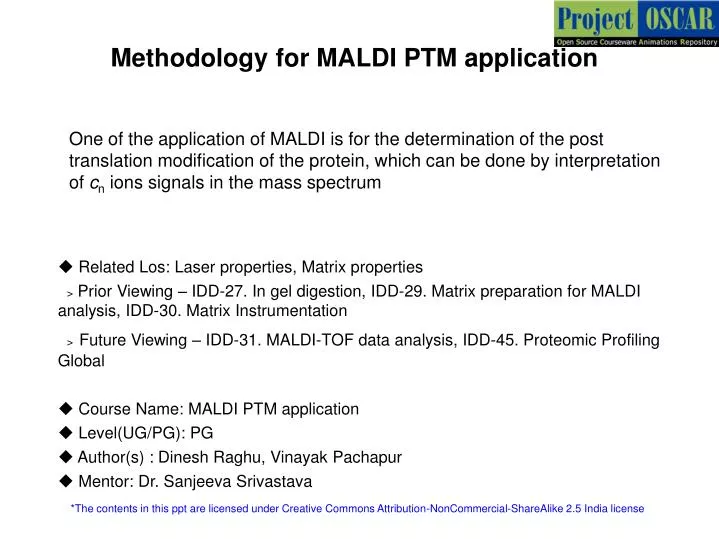
Methodology for MALDI PTM application One of the application of MALDI is for the determination of the post translation modification of the protein, which can be done by interpretation of cn ions signals in the mass spectrum • Related Los: Laser properties, Matrix properties > Prior Viewing – IDD-27. In gel digestion, IDD-29. Matrix preparation for MALDI analysis, IDD-30. Matrix Instrumentation >Future Viewing – IDD-31. MALDI-TOF data analysis, IDD-45. Proteomic Profiling Global • Course Name: MALDI PTM application • Level(UG/PG): PG • Author(s) :Dinesh Raghu, Vinayak Pachapur • Mentor: Dr. Sanjeeva Srivastava *The contents in this ppt are licensed under Creative Commons Attribution-NonCommercial-ShareAlike 2.5 India license
5 3 2 4 1 Learning objectives After interacting with this learning object, the learner will be able to: Operate the MALDI instrumentation Analyze the mechanism behind the MALDI-MS analysis Calculate the post translation modification Assess the troubleshooting steps involved in the experiments.
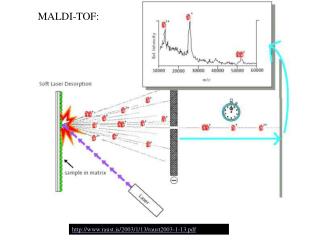
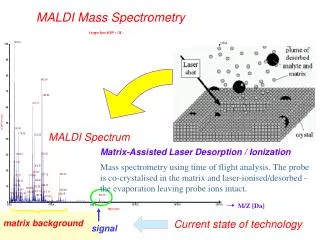
Definitions and Keywords 1 1. Mass Spectrometry (MS): is a analytical technique used to measure an intrinsic property of a bio-molecule, its mass, with very high dynamic sensitivity. 2. Matrix Assisted Laser Desorption Ionization (MALDI): MALDI is effective ionization system for generating gas-phase ions of proteins and peptides for mass spectrometric detection.The analyte of interest is embedded in dried matrix-sample is exposed to pulses from a UV laser for further separation and detection. • 3. PTM: Post translation modification, most protein tend to get modified after the post translation step before being functional. PTM plays an major role in making changes in the final product of expression and contributing towards diseases and biological processes. To name a few PTM’s • a) Phosphorylation: phosphate group addition at serine, tyrosine, threonine or histidine amino acid residue. • b) Glycosylation: carbohydrate/glycosyl group addition at either asparagine, hydroxylysine, serine, or threonine amino acid residue. • c) Acetylation: acetyl group addition at the N-terminus of the protein. • d) Methylation: methyl group addition at lysine or arginine residues. 2 3 4 5
Master Layout 1 Slide 5 Sample loading 2 Parameters setting Slide 6 Firing of spots 3 Slide 7 -9 Spectrum analysis for PTM Slide 10-15 4 5
Description of the action/ interactivity Audio Narration (if any) Step 1: T1:Sample loading 1 2 3 Take the user through the slides of IDD-29. Matrix preparation for MALDI analysis. Let user take the sample which have been phosporylated. 4 5
Description of the action/ interactivity Audio Narration (if any) Step 2: T2:Parameter settings 1 2 3 Take the user through the slides of IDD:30 MALDI instrumentation. Animate the steps from the same IDD till the firing step of sample. Let user take the sample as apomyoglobin as known standardand spot it on the MALDI plate. 4 5
Description of the action/ interactivity Audio Narration (if any) Step 3: T3:Firing of spots 1 2 3 Now let user select the actual target spot, by right-click on yellow region, and specifing the target spot and clicks on Fire button. Animate initially low peaks, now let user makes fine adjustment with 5 buttons, make movement in camera view also, now display more peaks with much high intensity. Let user keep playing around to complete 100 profiles. Now highlight Store button, after user click, let user have option to save the data. User must play around the spot region to find sweet spot, where the peaks are more in number with high intensity. After the 100profiles user can save the data. 4 5
Description of the action/ interactivity Audio Narration (if any) Step 3: T3:Firing of spots 1 2 3 Now user can select some other spot and start firing like in previous slide. In between firing, if user likes to pause, user hav a option like Abort, Resume. In case the peaks obtained are not fine, user can click on “abort” and click on “clear data” to clear all the data collected to re-start again. In between firing user have option for abort, resume, suspend and clear data. User can select these options depending on the profile data obtained. 4 5
Description of the action/ interactivity Audio Narration (if any) Step 3: T3:Firing of spots 1 2 3 In most cases the default parameters for peak processing are best suited. If user is not okay with the data collected, user can make peak processing with the required settings. Instruct user to carry out peak processing. Let user select Processing> peak processing. Display peak processing with user controls. Let user have option for methos selection, baseline subraction, threshold, average display of profiles. 4 5
Description of the action/ interactivity Audio Narration (if any) Step 4: • T4:Spectrum analysis 1 2 3 After peak processing the data is ready to be saved and exported. Let user select File>Export>ASCII. A small window display for user control must pop up. Let the user selects the default values ad clicks on Save as.. to open the Save As window. Browse to your desired location, enter a File name, and click ‘Save’. The PMF data will be saved. Once the PMF data is ready, data in the excel format can be exported, and saved. 4 5
Description of the action/ interactivity Audio Narration (if any) Step 4: • T4:Spectrum analysis 1 2 3 Instruct user to calculate the difference in mass/charge between two peaks. Animate the peaks labeled as c1, c2,c3...from one end (left side) and y1,y2,y3...from other end (right side) molecular mass. let user select any two peaks for “c” ions or “y” ions. For example in the figure highlight x1 and x2. let user make a note of it. The mass can be calculated from any two peaks by taking the difference and applying the formulas. 4 5
Description of the action/ interactivity Audio Narration (if any) Step 4: • T4:Spectrum analysis 1 2 3 mH: mass of hydraogen ataom Instruct user to calculate the molecular mass. Let user makes a difference of theoretical mass and observed mass. Let user tabulate the result accordingly in the figure. For the PTM identification, user need to have the information of observed mass from standard peaks, and even the mass value for each amino acids. 4 5
Description of the action/ interactivity Audio Narration (if any) Step 4: • T4:Spectrum analysis 1 2 3 mH: mass of hydraogen ataom Animate the highlighted row for user to make a note. Show the difference in the mass between the observed and theoretical mass. Display the change of 80.11 to highlighted. The difference in mass between observed and theoretical, determines the phosphate group addition. i.e PTM has taken place into the account on this particular amino acid. 4 5
Description of the action/ interactivity Audio Narration (if any) Step 4: • T4:Spectrum analysis 1 2 3 mH: mass of hydraogen ataom In similar way like in previous slide, depict to show a variation of 42Da, 43Da and 617.6Da. The 42Da difference corresponds to acetylation, 43Da for trimethylation and 617.6Da for Heme. 4 5
Description of the action/ interactivity Audio Narration (if any) Step 4: • T4:Spectrum analysis 1 2 3 In similar way the PTM can be identified if user has a basic knowledge of the amino acid mass. The difference in-between two adjacent peak mass helps to identify the PTM. If the difference value adds up to the phosphate, glycosylation, acetylation and methylation group determines the PTM. 4 5
Button 01 Button 02 Button 03 Slide 6 Slide 5 Slide 7 -9 Slide 10-15 Slide 1-4 Introduction Tab 01 Tab 02 Tab 03 Tab 04 Tab 05 Tab 06 Name of the section/stage Animation area • In slide-11: Provide a spectrum for user to identify, y ions and locate them accordingly? Interactivity area Instructions/ Working area Credits
Questionnaire: APPENDIX 1 Question 1 methyl group addition at _residues? • a) lysine • b) arginine • c) none • d) Both Answer : d) Both Question 2 acetyl group addition at the _of the protein? • N-terminus • C-terminus • y-terminus • Non of above Answer:a) N-terminus
Questionnaire: APPENDIX 1 Question 3 Mass of HexNAc1 + Na+ corresponds to? • 282 • 382 • 161 • 165 Answer : a) 282 Question 4 PTM of phosphate group corresponds to mass of? a) 75 b) 85 c) 80 d) 95 Answer: c) 80
APPENDIX 2 Links for further reading Papers: 1.Hillenkamp F, Karas M, Beavis RC, Chait BT. Matrix-assisted laser desorption/ionization mass spectrometry of biopolymers. Anal Chem. 1991, 63, 1193A-1203A. 2. Karas M, Glückmann M, Schäfer J. Ionization in matrix-assisted laser desorption/ionization: singly charged molecular ions are the lucky survivors. J Mass Spectrom. 2000, 35, 1-12. 3. Hillenkamp F, Karas M. Mass spectrometry of peptides and proteins by matrix-assisted ultraviolet laser desorption/ionization. Methods Enzymol. 1990, 193, 280-295. 4. John Lennon and Kenneth Walsh, Locating and identifying posttranslational modifications by in-source decay during MALDI-TOF mass spectrometry, Protein Science ~1999!, 8:2487–2493. Books: • Proteomics: A cold spring harbor laboratory course manual by Andrew J L and Joshua L, 2009.
APPENDIX 3 Summary MALDI-MS is the best technique used for proteomics. Lot of progress in instrumentation with additional applications continues to be made at a rapid pace. One of the popular best application is to identify the post translation modification by analysing the mass spectrum. One needs to have a through knowledge of all the amino acid mass.