Download
1 / 101
1.02k likes | 1.26k Vues
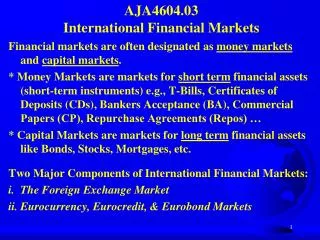
International Financial Markets 4. Financial Market Crises. 4. Financial Market Crises. 4. Financial Market Crises 4.1. The Ingredients of a Financial Market Crisis 4.2. Lessons from History 4.2.1. The Dutch Tulip Crisis 1636-37 4.2.2. The World Economic Crisis of 1929

E N D
International Financial Markets4. Financial Market Crises Prof. Dr. Rainer Maurer
4. Financial Market Crises 4. Financial Market Crises 4.1. The Ingredients of a Financial Market Crisis 4.2. Lessons from History 4.2.1. The Dutch Tulip Crisis 1636-37 4.2.2. The World Economic Crisis of 1929 4.2.3. The Dot-com Crisis 2000 4.2.4. The Subprime Crisis 2007-09 4.2.5. The East Asian Financial Market Crisis 1997-98 Prof. Dr. Rainer Maurer
4.1. The Ingredients of a Financial Market Crisis • The basic ingredients of a financial market crisis: • An Initial Shock • A Positive Feedback Mechanism • A Funding Source • A Negative Shock • The first three ingredients create a speculative bubble. • The last ingredient is the needle, which bursts the bubble. Prof. Dr. Rainer Maurer
4.1. The Ingredients of a Financial Market Crisis • A Initial Shock • Most historically observed financial market crisis were started by a unpredictable event – a shock. • As we will see such shocks can be: • Technological Innovations: • New products, services, production technologies, raw materials… • Financial Market Innovations • New assets, derivatives, investment strategies… • Financial Market Deregulation • Less restrictions concerning prices, own capital, scope of markets • Political Events • Change of governments, end of wars, international agreements… Prof. Dr. Rainer Maurer
4.1. The Ingredients of a Financial Market Crisis • A Positive Feedback Mechanism • Most important ingredient: • An event reproduces the conditions of its own creation. • Markets for assets have a susceptibility for such feedback mechanisms if people rely on naïve expectations. • Naïve expectations are given, if people believe that the currently observable increase of prices will hold on in the future: • “Next months increase of stock prices, will be equal to the current increase of stock prices.” Prof. Dr. Rainer Maurer
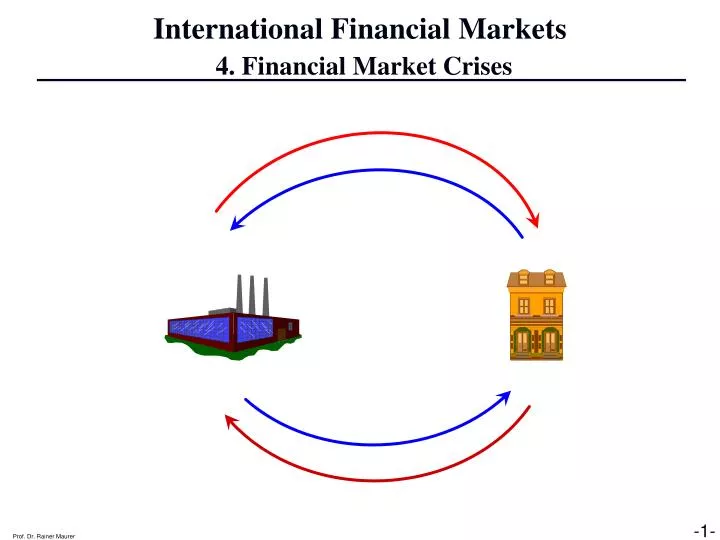
Contradiction to standard neoclassical theories! 4.1. The Ingredients of a Financial Market Crisis • A Positive Feedback Mechanism: Purchases of the asset in order to profit from the price increase Demand of the asset grows stronger than supply Expectations of an asset price increase Asset price increases Naïve expectations Prof. Dr. Rainer Maurer
4.1. The Ingredients of a Financial Market Crisis P The expected price of the next period equals the current price: Et(Pt+1) = P1t => No additional purchases by speculators Period: t XS P1t X XD(Pt, Et(Pt+1) = P1t) X1t Prof. Dr. Rainer Maurer Prof. Dr. Rainer Maurer
4.1. The Ingredients of a Financial Market Crisis P Change: New information (=initial shock) leads to a higher expected price of the next period: Et(Pt+1) > P1t => Additional purchases by speculators Period: t XS P2t P1t XD(Pt, Et(Pt+1) > P1t) X XD(Pt, Et(Pt+1) = P1t) X1t X2t Prof. Dr. Rainer Maurer Prof. Dr. Rainer Maurer
4.1. The Ingredients of a Financial Market Crisis P Now naïve expectations lead to a higher expected price of the next period Et+1(Pt+2)= P1t+1*(P1t+1-P1t)/P1t > P1t+1 => Further purchases by speculators Period: t+1 XS P2t+1 P1t+1= P2t P1t XD(Pt+1, Et+1(Pt+2) > P1t+1) XD(Pt, Et(Pt+1) > P1t) XD(Pt, Et(Pt+1) > P1t) X XD(Pt, Et(Pt+1) = P1t) X1t X2t X3t Prof. Dr. Rainer Maurer Prof. Dr. Rainer Maurer
4.1. The Ingredients of a Financial Market Crisis • A “Funding Source” • In order to keep the positive feedback mechanism running, people must have the financial means to buy the “feedback asset”. As history shows there can be different sources of such means: • Reduction of consumption demand = increase in savings available for investment in the “feedback asset”. • Restructuring of portfolios: For example, less demand for fixed rate securities in favor of the demand for the “feedback asset”. • Increase in money supply (=credit supply) by the central bank provide the means for investment in the “feedback asset”. • Increase in foreign investment for example due to an economic opening of a country for trade and capital. • Acquisition of foreign wealth: Discoveries of natural resources, colonialism, war reparations... Prof. Dr. Rainer Maurer
4.1. The Ingredients of a Financial Market Crisis • A Negative Shock • Without a negative feedback shock, the positive feedback mechanism would go on for ever. • However, many positive feedback mechanisms bear a root of their self-destruction, which emerges in the long run: • Feedback mechanisms based on a reduction of consumption good demand cause a recession and a reduction of firm profits and hence the value of assets and goods depending on firm profits. • Feedback mechanisms based on an increase in money supply may be followed by an increase in inflation, which causes a recession. • Feedback mechanisms based on an increase in foreign investment may be followed by an appreciation of domestic currency, which causes a reduction of firm profits. Prof. Dr. Rainer Maurer
4.1. The Ingredients of a Financial Market Crisis • A Negative Shock • Without a negative feedback shock, the positive feedback mechanism would go on for ever. • However, many positive feedback mechanisms bear a root of their self-destruction, which emerges in the long run: • Feedback mechanisms based on a reduction of consumption good demand cause a recession and a reduction of firm profits and hence the value of assets and goods depending on firm profits. • Feedback mechanisms based on an increase in money supply may be followed by an increase in inflation, which causes a recession. • Feedback mechanisms based on an increase in foreign investment may be followed by an appreciation of domestic currency, which causes a reduction of firm profits. Prof. Dr. Rainer Maurer
2. Major Markets and Their Assets2.1.2. Stock Markets Can price bubbles be rational? Yes! There are two set of assumptions under which bubbles can be rational: 1. Exponentially growing imploding bubbles …are possible, if the price increase is large enough to compensate holders of the bubble-asset for the risk of bubble implosion, i.e. if the risk premium is constantly growing. It is easy to show that this implies an exponentially growing price. Hence this type of bubble will always implode very fast. If the Digression Price increase per unit time becomes “close to vertical”, the risk premium cannot grow any longer strong enough and the bubble must implode. The life-time of such a bubble will therefore be quite short. P “Rational Chicken Game” t - 17 - Prof. Dr. Rainer Maurer
2. Major Markets and Their Assets2.1.2. Stock Markets Can price bubbles be rational? Yes! There are two set of assumptions under which bubbles can be rational: 2. Infinitely growing non-imploding bubbles (1) A natural limit for an asset price is the GDP of the country to which the asset (e.g. a stock company or a real estate object) belongs. Consequently, if the present value of the GDP of a country is finite, the market price of the asset must also be finite, i.e. an infinitely growing bubble is not possible. If however the transversality condition does not hold, the discount interest rate (=r), will be smaller than the growth rate of GDP (=g). In this case the present value of GDP is infinite for T→∞ : Digression - 18 - Prof. Dr. Rainer Maurer
2. Major Markets and Their Assets2.1.2. Stock Markets Can price bubbles be rational? Yes! There are two set of assumptions under which bubbles can be rational: 2. Infinitely growing non-imploding bubbles (2) In this case, an asset price can be steadily growing without becoming larger than the GDP of the corresponding country, i.e. if g > π ≥ r and the price of an asset can be permanently larger than its fair value: Digression - 19 - Prof. Dr. Rainer Maurer
2. Major Markets and Their Assets2.1.2. Stock Markets Does the transversality condition hold in the long-run? Digression - 20 - Prof. Dr. Rainer Maurer
4. Financial Market Crises 4. Financial Market Crises 4.1. The Ingredients of a Financial Market Crisis 4.2. Lessons from History 4.2.1. The Dutch Tulip Crisis 1636-37 4.2.2. The World Economic Crisis of 1929 4.2.3. The Dot-com Crisis 2000 4.2.4. The Subprime Crisis 2007-09 4.2.5. The East Asian Financial Market Crisis 1997-98 Prof. Dr. Rainer Maurer
4.2. Lessons from History4.2.1. The Dutch Tulip Crisis 1636-37 • The Netherlands (United Provinces) experienced period of increased economic growth between 1630 and 1660 due to the end of the Eighty Years’ War with Spain and the dominance of Dutch merchants in the European trade with East India. • Beneath the established class of nobility the new class of wealthy citizens (merchants and artisans - the “nouveaux riches” of those times) emerged. • The tulip came to Europe in the middle of the 16th century from Turkey. • The botanist Charles de L’Ecluse (University of Leiden) succeeded to breed a variant of tulips, which was able to tolerate the harsher climatic conditions of the Netherlands. This started an intensified cultivation of Tulips in the Netherlands. Prof. Dr. Rainer Maurer
4.2. Lessons from History4.2.1. The Dutch Tulip Crisis 1636-37 • Tulips became popular boosted by the “prestigecompetition” between the members of nobility and the upcoming class of wealthy citizens for possession of the rarest tulips. • A tulip-specific virus, called "Tulip Breaking potyvirus”, caused new variants of tulips, which became very popular and were highly sought-after, such as the variant called “Semper Augustus” (see picture). • In 1632, a bulb of a famous tulip variety could cost as much as a 1000 Dutch florins (= 7-times the average yearly income = 33 fat swine = 10 tons of butter) • By 1635, a sale of 40 bulbs was recorded worth 2500 Dutch florins for one bulb (16-times the average yearly income). • At the peak of the fever 1637, the record price of 6000 Dutch florins (40-times the average yearly income) was paid for one bulb of “Semper Augustus”. Prof. Dr. Rainer Maurer
4.2. Lessons from History4.2.1. The Dutch Tulip Crisis 1636-37 • By 1636, tulips were traded on the stock exchanges of numerous Dutch towns and cities. • This encouraged the ultimate “tulip fever” with trading in tulips by all members of society, and many people selling or trading their other possessions (houses, farms…) in order to speculate in the tulip market. • Traders sold tulip bulbs that had only just been planted or those they intended to plant (futures contracts). • The trade of these futures took place mostly in the taverns and markets even in small towns. • In spring 1637 the bubble burst, when at an auction in Altmahr a trader in future contracts found no demand for his contracts. • The news spread very fast across villages and towns and the price of tulip bulbs decreased to less than one hundredth of the peak prices. Prof. Dr. Rainer Maurer
4.2. Lessons from History4.2.1. The Dutch Tulip Crisis 1636-37 • The economic aftermath of the tulip price crash was a decline in economic activity, caused by the loss of wealth of many households, which had speculated in tulips. • Given the sound economic background of the Dutch economy the recession was only mild and strong investment in stocks (foreign trade companies) and building projects (drainage systems, channels etc,.) soon returned. • The long-run impact of the tulipmania to the Dutch economy was certainly very positive: Today, with more than 2 billion tulips harvested every year, the Netherlands are world market leader in (but not only) tulips. Prof. Dr. Rainer Maurer
4.2. Lessons from History4.2.1. The Dutch Tulip Crisis 1636-37 • Does the Dutch Tulip Crisis exhibits the ingredients of a typical financial market crisis? • Initial Shock: • Technological innovation: A new product (tulips) was discovered and cultivated to bear the harsher climatic conditions of the Netherlands. • Positive Feedback Mechanism: • Increase in demand for tulips by wealthy citizens led to an increase in prices. Increase in prices led to an expectation of further prices increases. Expectation of further price increases led to an increase in the demand for tulips and so on. Prof. Dr. Rainer Maurer
4.2. Lessons from History4.2.1. The Dutch Tulip Crisis 1636-37 • Does the Dutch Tulip Crisis exhibits the ingredients of a typical financial market crisis? • Funding Source: • Higher income of the whole population from a reduction of war expenditures and the dominanceof Europeanforeign trade with East India, which caused in inflow of gold and silver. • Negative Shock: • Singular event: 1637 auction at Altmahr – probably caused by a switch from “naïve expectations” to “more rationalexpectations”. Prof. Dr. Rainer Maurer
4.2. Lessons from History4.2.1. The Dutch Tulip Crisis 1636-37 http://www.youtube.com/watch?v=Km5KS7U9aOc „The Great Contemporary Art Bubble“ Caricature of investors’ behavior during the Dutch “Tulipmania” by Jan Brueghel the Younger (1640), Frans Hals Museum, Haarlem, Netherlands. Prof. Dr. Rainer Maurer
4. Financial Market Crises 4. Financial Market Crises 4.1. The Ingredients of a Financial Market Crisis 4.2. Lessons from History 4.2.1. The Dutch Tulip Crisis 1636-37 4.2.2. The World Economic Crisis of 1929 4.2.3. The Dot-com Crisis 2000 4.2.4. The Subprime Crisis 2007-09 4.2.5. The East Asian Financial Market Crisis 1997-98 Prof. Dr. Rainer Maurer
4.2. Lessons from History4.2.2. The World Economic Crisis of 1929 • From 1920 to 1929 the US-economy and the economies of many other industrialized countries experienced a period of fast economic growth – the “roaring twenties”. • Several factors favored this development: • The economic aftermaths of the World War I (1914-18) were overcome in most countries; the world economy benefited from a period of relative stability. • International trade regained momentum. • New technologies came up like: electronics (radio, TV, wireless com-munication), mass production of radios, cars and other durable consumer goods, electrification of households,… • These technologies inspired fantasies about new profit opportunities. New stock corporations were founded and brought large price gains to early investors. More and more people started investing in stock. Prof. Dr. Rainer Maurer
The Development of the Dow Jones Index Before and After the World Economic Crisis of 1929 Prof. Dr. Rainer Maurer
The upward trend of corporate profits during the 20s gave rise to expectations of further profit growth Prof. Dr. Rainer Maurer
4.2. Lessons from History4.2.2. The World Economic Crisis of 1929 • The American central bank Fedinjected a lot of money after World War I and in the course of the twenties into the US-economy, which led (via the money multiplier (see Chapter 3.1)) to an increasedcreation of money backed credits by commercial banks. Prof. Dr. Rainer Maurer
Start of Expansionary Monetary Policy by the Federal Reserve 4.2. Lessons from History4.2.2. The World Economic Crisis of 1929 Prof. Dr. Rainer Maurer
Money Growth Stronger than Growth of Real Income plus Inflation 4.2. Lessons from History4.2.2. The World Economic Crisis of 1929 This indicates that a part of money supply has not flown in the demand for goods but in the demand for shares. => “Asset Inflation” Prof. Dr. Rainer Maurer
4.2. Lessons from History4.2.2. The World Economic Crisis of 1929 • These credits flew in part to private households as consumer credits and in part to investors. • Consumer used credits to buy newly available consumer goods like radios, refrigerators, kitchenware, cars. Therefore, many firms made large profits. • Investors used credits to buy stocks of “new technology corporations”. • Newly developed investment funds offered shares to normal households, which had so far not invested their savings in stock (“milkmaid hausse”) • The supply of cheap credits induce even average households to buy stock financed with credits (“milkmaid hausse”). • The expansion of the demand for stocks led to a boost of stock market prices: • Between 1925 and 1929 the Dow Jones Index grew from about 100 to 380 = 39,6% growth per year. • For example the share of the “Radio Corporation of America” (RCA) had a value of 5$ in 1925, which reached a value of 500 $ in 1929 = 216,2% growth per year. Prof. Dr. Rainer Maurer
4.2. Lessons from History4.2.2. The World Economic Crisis of 1929 • In summer 1929 the American economy started to cool down, which was in part a result of a more restrictive monetary policy by the Fed, which had caused an increase of interest rates from 1927-29. • The stock market became more and more nervous in the course of the summer and finally started to collapse on Thursday the 23rd of October. • By an intervention of four large commercial banks (J.P. Morgan, National City, Chase National, Guaranty Trust), which bought large volumes of stock, prices recovered. • But the following Monday selling began and a real panic started. The Dow Jones lost 12,8 % on one day. Stock prices fell from their max at 381 to a level of 198 in a couple of days. Until April 1930 prices recovered up to a level of nearly 300. • However, the deterioration of the real economy caused then a steadily slide of prices until summer 1932, when the Dow Jones index reached the bottom with 41 index points. Prof. Dr. Rainer Maurer
The Development of the Dow Jones Index Before and After the World Economic Crisis of 1929 Prof. Dr. Rainer Maurer
4.2. Lessons from History4.2.2. The World Economic Crisis of 1929 • What was most severe, was the hardship which with this stock market crisis hit the real economy: • Since many people – from business man to worker – had invested in stock, many people lost net wealth. • Their lower net wealth led to lower demandfor goods. • In the short run, firms adjusted their supply of goods to the lower demand for goods, what led to a lower level of production. • The decrease in goods production led to reduction in the firms’ demand for labor. • The decrease in the demand for labor led to a tremendous increase in unemployment. • Increasing unemployment led to even lower incomes of the largest part of the population, which caused a further reduction of the demand for goods. • The typical Keynesian demand side caused recession mechanism gained strong momentum. Prof. Dr. Rainer Maurer
4.2. Lessons from History4.2.2. The World Economic Crisis of 1929 Prof. Dr. Rainer Maurer - 43 - Prof. Dr. Rainer Maurer
4.2. Lessons from History4.2.2. The World Economic Crisis of 1929 Prof. Dr. Rainer Maurer - 44 - Prof. Dr. Rainer Maurer
4.2. Lessons from History4.2.2. The World Economic Crisis of 1929 • The Fed – first not realizing these devastating effects on the real economy – did not turned around its restrictive monetary policy in the first month after the stock market collapse. • Only by summer 1933 did the Fed start to switch to a more expansionary monetary policy and decreased interest rates. • This was, however, to late. Since many debtors, firms, investment funds and private households were unable to pay back their credits, a couple of banks had to declare bankruptcy. • As a consequence, bank runs took place, where depositors (creditors) wanted their money back (because they feared further bankruptcies). • Since the Fed was first not willing to help these banks with cheap central bank money credits, many banks failed: during the first 10 months of 1930, 744 US banks failed. • By 1933, depositors had lost $140 billion in deposits. Prof. Dr. Rainer Maurer
Restrictive monetary policy by the Fed caused deflation and deepened the recession! Prof. Dr. Rainer Maure
4.2. Lessons from History 4.2.2. The World Economic Crisis of 1929 • Did the World Economic Crisis of 1929 exhibit the ingredients of a typical financial market crisis? • Initial Shock: • Technological innovations: New technologies (electronics, mass production, automotive engineering) gave rise to fantasies: “New Era”, “This time it’s different” • Positive Feedback Mechanism: • Increase in demand for stocks by investments funds and private households led to an increase in stock market prices. Increase in prices led to an expectation of further price increases. Expectation of further price increases led once again to an increase in the demand for stocks and so on. Prof. Dr. Rainer Maurer
4.2. Lessons from History 4.2.2. The World Economic Crisis of 1929 • Did the World Economic Crisis of 1929 exhibit the ingredients of a typical financial market crisis? • Funding Source: • Expansionary monetary policy in interaction with the credit expansion of commercial banks supplied cheap credits, which boosted the demand for stocks. • Negative Shock: • Gradual cooling-down of the American economy, probably caused by the more restrictive monetary policy of the Fed in the years 1927-29. Prof. Dr. Rainer Maurer
4. Financial Market Crises 4. Financial Market Crises 4.1. The Ingredients of a Financial Market Crisis 4.2. Lessons from History 4.2.1. The Dutch Tulip Crisis 1636-37 4.2.2. The World Economic Crisis of 1929 4.2.3. The Dot-com Crisis 2000 4.2.4. The Subprime Crisis 2007-09 4.2.5. The East Asian Financial Market Crisis 1997-98 Prof. Dr. Rainer Maurer
4.2. Lessons from History4.2.3. The Dot-com Crisis 2000 • The dot-com bubble (also IT-bubble) started somewhere around 1995 and burst in March 2000. • The bubble infected mainly the stock market prices of internet-, telecommunications-, and software-firms – the so called “New Economy”. • The prices of firms that be- longed to the “Old Economy” did not explode to the same degree, as a comparison of the NASDAQ Index (IXIC) with the Dow Jones Industrial Index (DJI) reveals. • Consequently, similar as the stock market bubble that led to the World Economic Crisis of 1929, the availability of new technologies and the “profit-fantasies” they caused started the bubble. Prof. Dr. Rainer Maurer
4.2. Lessons from History4.2.3. The Dot-com Crisis 2000 By the end of the year 2000 the NASDAQ-P/E-ratio was above 60 (= 1,6% “earnings yield”) • “New business models” for new eco-nomy corporations were created, pro-pagated and finally sold to investors. • Following these business models, the typical market structure of the new economy is characterized by network products. The corporation that grows fasted is able to set the network-standard and finally monopolize the market. Successful IT corporations like Microsoft had inspired this business model. NASDAQ Price/Earnings Ratio • Consequently, not the profit of a new economy corporation stood at the center of interest, but the growth of its market share or customer base: “Get large or get lost!” was the motto of the day. • Some analysts even interpreted a large loss (the “capital burn rate”) as an indicator of a fast expanding market share and hence of the “long-run” pro-fitability of a firm. Prof. Dr. Rainer Maurer
4.2. Lessons from History4.2.3. The Dot-com Crisis 2000 • The first corporations based on such business models, which were brought to the stock market by venture capital companies, provided their owners remarkable high price gains of 50% and more on the first trading day: • When the German Corporation Siemens sold its subsidiary „Infineon“ at an issuing price of 35€, the price reached a level of 85€ at the same day. (Today the price comes close to 7,77€.) • Such gains attracted the attentionof the public. Even people that never cared much about the stock market, started to invest in stock. • The “chase” for new public offers of stocks became a popular sport. • In Germany two events stood at the beginning of this hype: • The opening of the “Neue Markt”, the German equivalent to the NASDAQ, in March 1997. • The initial public offering (IPO) of the German Telekomin Novem-ber 1996, whose stocks were popularized as “people’s stock” (“Volksaktie”) by a large-scale TV-advertising campaign. (Issuing price 14,7€, high 104€ in March 2000, today: 10,02€) Prof. Dr. Rainer Maurer
4.2. Lessons from History4.2.3. The Dot-com Crisis 2000 • Talking about the stock market became as popular as talking about famous football clubs or pop stars. Manager of New Economy corporations even became a kind of pop stars themselves. • A lot of people reallocated their savings and retirement provisions from low risk securities to stocks. US pension funds offered their clients the possibility to reallocate themselves their accounts among stocks, bonds and money market assets. Large price gains of stocks led more and more people to shift an important share of their retirement provision to stock funds. • Monetary policy in the USA and other countries did not actively fight the booming stock market: From February 2, 1995, to August 24, 1999, the Fed did not increase its target interest rate, with a one-time exception of 0,25 % in March 1997. Prof. Dr. Rainer Maure Prof. Dr. Rainer Maurer
+ 45% Expansionary Monetary Policy Prof. Dr. Rainer Maurer
4.2. Lessons from History4.2.3. The Dot-com Crisis 2000 • From June 1999 to March 2000 the Fedincreased its Federal Funds target rate successively from 5% to 6%. • In February 2000 the Dutch internet retailer Boo.com declared bankruptcy. • In March 2000 The US-financial magazine Barron’s published a list with 51 new economy corporations that were likely to declare bankruptcy over the next 12 month. • At the March 10 weekend most high-tech stock market indexes reached their peaks. • At Monday March 13 selling started. Until the end of March most high-tech indexes lost more than 25%. • Many New Economy corporations could no longer finance their losses by selling new stocks and had to declare bankruptcy. • The decline of the NASDAQ came not to a standstill until October of the year 2003. Prof. Dr. Rainer Maurer
4.2. Lessons from History4.2.3. The Dot-com Crisis 2000 • Many people lost their savings and reduced their demand for goods. This caused a recession in most developed countries. • Contrary to the situation after 1929 (where the Fed reacted to late), the Fed (and many other central banks) under governor Allen Greenspan actively fought the recession and lowered their interest rates by injecting a lot of money to their economies. • The lower interest rates stabilized the demand for goods and – most likely – prevented the world economy from a severe recession as experienced after the stock market crash of 1929. • However, critics of this policy argue that the “cheap money” injected by the Fed from 2001 to 2005 causedthe real estate bubble that led to the “subprime crisis” of our days. Prof. Dr. Rainer Maurer
+ 27% + 45% Expansionary Monetary Policy Prof. Dr. Rainer Maurer