Download
1 / 44
550 likes | 774 Vues
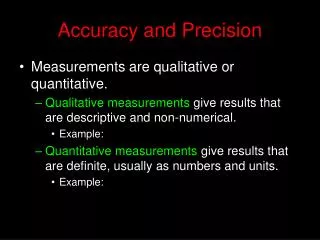
Accuracy and Precision in Powder Diffractometry. A. Kern Bruker AXS GmbH Östliche Rheinbrückenstraße 50 D-76187 Karlsruhe. Topics to be covered. Accuracy and Precision in Powder Diffractometry Definition Optimized Measurement and Evaluation Strategies: Early Decisions Sample Instrument

E N D
Accuracy and Precisionin Powder Diffractometry A. Kern Bruker AXS GmbHÖstliche Rheinbrückenstraße 50D-76187 Karlsruhe
Topics to be covered Accuracy and Precision in Powder Diffractometry • Definition • Optimized Measurement and Evaluation Strategies: • Early Decisions • Sample • Instrument • Data Colletion Strategies • Optimized Evaluation Procedures
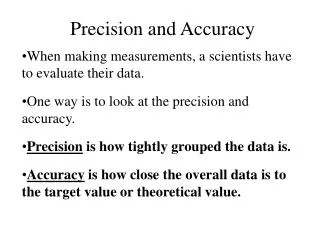
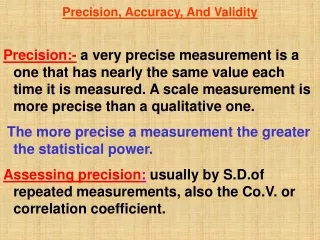
Definition of Terms:“Accuracy” - “Precision” • Legend: Z : Measurand = “true” value A : Measurement result AS : Accuracy AR : Precision = standard deviation
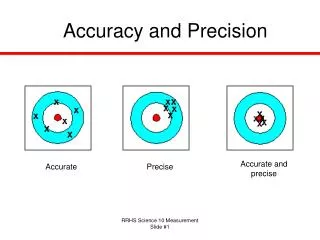
High Accuracy High Accuracy High Precision Low Precision Low Accuracy Low Accuracy High Precision Low Precision Accurate Powder Diffractometry Precise or Accurate Results? Tissue, 1996
Early Decisions DataCollection Sample Instrument Evaluation The Experiment:Overview • Any diffraction experiment ca be devided in 5 parts: • Without a close consideration of each part, which must be repeated for each different experiment, one will most unlikely obtain an optimum analytical outcome
What is the aim of the experiment? What accuracy and precision is necessary? What are the sample properties? What instrument and measurement parameters to use? What evaluation methods and models to use? Early Decisions:Step by Step By answering all these questions before executing any experiment on can save a whole lot of time as well as protect himself against erroneous results and frustration!
Early Decisions:General Conditions • What is the form of the sample? • How much sample is there? • What instruments are available? • Waht instrument setup are available? • Primary optics? • Sample holders? • Detectors? • What intensity / resolution is required? • ...
Methodical limits • Peak overlap • Scattering factors • Speed of analysis • Measurement errors • Physical effects • Geometric effects • Alignment errors • Others... Accuracy and precision of results • Calibration errors • Uncalibratable errors • Use of standards • Quality of calibration • Evaluation errors • Software errors • User errors • Quality of methods Early Decisions: Accuracy / Precision needed
Identification and quantification of errors Minimizing of errors using optimized measurement and evaluation strategies Correction of errors by means of calibration Checking of results Early Decisions:“Fitting the Experiment to the Need”
The Sample:General Considerations • One of the most important steps before data collection is the minimisation of systematic sample related effects. This is as important as the minimisation of instrumental aberations! • Avoid persisting with poor data - if possible • Re-prepare or remake the sample • Find a better sample • Change instrument or instrument setup • Improve instrument and measurement parameters
The Sample:Typical sample related problems • Not enough scattering particles (spotiness) • Sample not representative for the bulk • Bad sampling / particle heterogeneity / phase separation • Preferred orientation • Extinction • Microabsortion (multiphase samples) • “Sample problems” can also provide important informations: • preferred orientation degree of orientation • peak broadening crystallite size and strain
Back pressing, side drifting not effective on preferred orientation in all cases Use of capillary techniques most effective intensity and resolution losses not automatable Addition of diluents contamination enhanced transparency amorphous scatter /additional peaks Spray drying expensive equipment large sample amount needed lavish cleaning of equipment Sample motion motion should be 90° to the diffraction vector improves particle statistics no effect on preferred orientation in Bragg-Brentano reflection geometry The Sample:Preparation The grains in a powder should be randomly oriented:
The Sample:Number of Crystallites needed • Peak intensities for structure refinement required to be accurate to ±2% • Accurate, reproducible diffraction intensities require small crystallite size typical intensity reproducibility for Quartz (113) reflection with CuK: is 15-20 m 5-50 m 5-15 m <5 m 18.2% 10.1% 2.1% 1.2% • The number of crystallites diffracting is related to size diameter 40 m 10 m 1 m crystallites / 20mm3 597.000 38.000.000 3.820.000.000 number diffracting 12 760 38.000 Smith, 1992
Bragg-Brentano Reflection Debye-Scherrer Capillary The Sample:Sample Motion - Two Examples Rotation parallel to the scattering vector does not minimize preferred orientation effects!
The Instrument:General Considerations • The choice of the optimum instrument must consider the aim of the experiment as well as specific sample properties. • Whats the aim of the experiment • Radiation? • Geometry? • Instrumental setup (optics, sample carriers, detectors)?
Auflösung 2 Intensität Qualitative Analyse Quantitative Analyse Indexing Struktur Lösung Rietveld Analyse Welches Instrument:Was ist das Ziel des Experiments? Wann werden folgende Profilparameter benötigt:
The Instrument:What Radiation to use? Neutrons X-Ray Laboratory X-Ray Synchrotron Intensity Resolution Absorption problems small / reflection small / reflection Atom discrimination Light atoms Small samples Availability
The Instrument:What Geometry to use? DS Conventional BB DSGöbel Optics Intensity reflection Resolution reflection P/B reflection Weak scattering reflection Absorption reflection / -2 Preferred orientation capillary Sample amount capillary Non ambient
The Instrument:Debye-Scherrer / Bragg-Brentano Bragg-Brentano Reflection Debye-Scherrer Capillary
The Instrument:Effect of Absorption • Bragg-Brentano • Absorption is independent of 2: Constant diffraction volume • Transparency effect may cause problems • High absorption : Use reflection geometry • Low absorption : Use transmission geometry • Debye-Scherrer • Absorption is 2-dependent:Variable diffraction volume • An intensity correction (effR) is crucial, if accurate intensities are needed
Fixed Variable Beam divergence Fixed Variable Illuminated sample length Fixed Variable Diffraction volume Constant Variable The Instrument:Fixed or variable Divergence Slits (I) Never use variable divergence slits for structure analysis! Fix them always to constant beam divergence!
Fixed divergence slits Variable divergence slits The Instrument:Fixed or variable Divergence Slits (II)
Scintillation detector PSD HI-STAR / CDD • large 2range measured simultaneously • medium measuring time • small spot measured • scan necessary • long measuring time • large 2 and chi range measured simultaneously • very short measuring times • measurement of oriented samples and very small sample amounts The Instrument:Point-, Line- and Area-Detectors
The Instrument:Powder Diffraction using 2-D Detectors Amorphous Sample Crystalline Sample Heavily oriented crystalline sample with amorphous content
Data Collection:General Considerations A very crucial step in each experiment is the choice of optimum instrument and measurement parameters. Important examples are: • Sample carrier material • Receiving slit • Divergence and anti-scatter slits • Soller slit(s)
Data Collection:Counting Statistics - Detection Limit Jenkins, 1989
Scintillation counter FWHM = 0.038° 2 Position sensitive detector FWHM = 0.046° 2 Instrument Resolution (I):D500 with Ge-Primary Monochromator
Instrument Resolution (II):D8 ADVANCE • Scintillation counter • FWHM = 0.030° 2
Evaluation:Most important Errors • Software errors • User errors, e.g. • Smoothing • Background subtraction • Quality of methods, e.g. • 2-Determination • 2nd derivative • Profile fitting
Evaluation:Gaussian and Lorentzian Function I I Rel Rel 100 100 Gaussian Lorentzian Si 111 Si 111 80 80 60 60 40 40 20 20 0 0 28.00 28.20 28.40 28.60 28.80 29.00 28.00 28.20 28.40 28.60 28.80 29.00
Evaluation:Split-PearsonVII Function I Rel 100 Split- PearsonVII 80 Si 111 60 40 20 0 28.00 28.20 28.40 28.60 28.80 29.00
Evaluation:Calibration • Instrument alignment • Crucial for alignment checking and alignment. Use always the same sample! • Internal calibration • Standard added to the sample. Almost all errors can be corrected • External calibration • Standard used external to the sample. Does not correct for important errors like sample displacement and transparency!
Evaluation:List of recent NIST XRD Standards Material SRM Number Certified for Silicon SRM 640b d-value calibration Fluoro-Phlogopite SRM 675 d-value calibration -Al2O3 SRM 1976 intensity calibration, instrument alignment LaB6 SRM 660 profile analysis -Al2O3 SRM 676 quantitative analysis -Si3N4, -Si3N4 SRM 656 quantitative analysis -Quartz SRM 1978a quantitative analysis Cristobalite SRM 1979a quantitative analysis -Al2O3, ZnO, TiO2, SRM 674a quantitative analysis Cr2O3, CeO2
Evaluation:Accuracy of XRD results • Lattice parameters : ~ 0.001% 2 ~ 0.003° 2 • Thermal expansion L/L : < 3% • Atom coordinates : < ± 1 • Temperature factors : < 50%
Bruker AXS:Diffraction Solutions Diffraction solutions is our comprehensive, application oriented package consisting of • High-precision, fast and innovative analysis technology for all your needs • Hardware • Software • Supply of analytical and technical expertise - knowledge transfer between customer and supplier • Application support, consulting • User trainings • Workshops • User meetings