Download
1 / 70
700 likes | 872 Vues
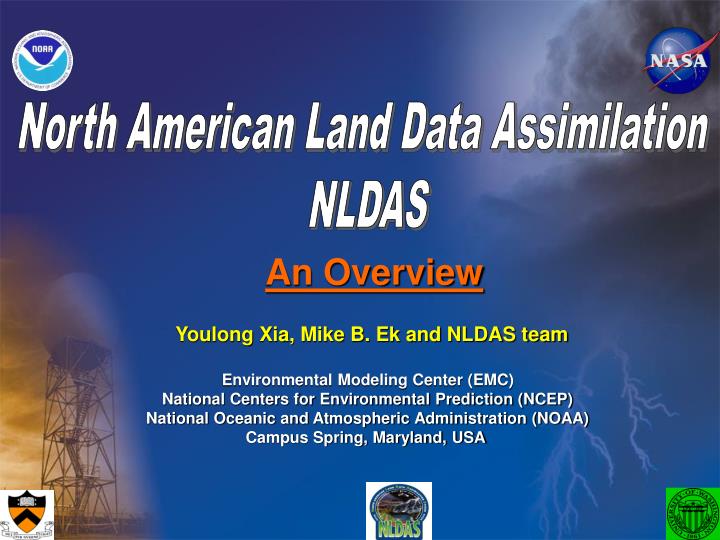
North American Land Data Assimilation NLDAS. An Overview. Youlong Xia, Mike B. Ek and NLDAS team. Environmental Modeling Center (EMC) National Centers for Environmental Prediction (NCEP) National Oceanic and Atmospheric Administration (NOAA) Campus Spring, Maryland, USA. Outline.

E N D
North American Land Data Assimilation NLDAS An Overview Youlong Xia, Mike B. Ek and NLDAS team Environmental Modeling Center (EMC) National Centers for Environmental Prediction (NCEP) National Oceanic and Atmospheric Administration (NOAA) Campus Spring, Maryland, USA
Outline 1. Introduction 2. NLDAS phase 1 - NLDAS-1 3. NLDAS Phase 2 - NLDAS-2 4. Summary and Future Direction
Outline 1. Introduction 2. NLDAS phase 1 - NLDAS-1 3. NLDAS Phase 2 - NLDAS-2 4. Summary and Future Direction
NLDAS Drought Monitor Southern Canada Model Precipitation USA Gauge Precipitation Northern Mexico Model +Gauge What is NLDAS? NLDAS – North American Land Data Assimilation System (Uncoupled or Offline) NLDAS Study Domain
NLDAS Concept Atmospheric Forcing Gauge measured precipitation, bias corrected downward solar radiation, Other variables from NCEP National Regional Reanalysis NOAA NWS, NCEP, NSDIS Scientists Improvement Multiple Land Surface Models LIS Ensemble Kalman Filter Soil and Vegetation Parameters River routing Model Model Development Improvement Evaluation Calibration In-situ observation Satellite retrieved data Multi-Institution Scientists
NDAS History Two-Phase NLDAS: NLDAS-1 and NLDAS-2 NLDAS-1 Pioneer work Start in 2000 and end in 2005 Construction of configuration and framework 3-year (97-99) run for NLDAS domain validation and evaluation of products NLDAS-2 Start in 2006 and still underway Extension to 31 years (79-current) Improved forcing and models Real-time execution to support U.S. Drought Monitoring Transition to NCEP operations
NLDAS Parternership Collaborators: NOAA, NASA, Princeton Univ., Rutgers Univ., Univ. Washington, Univ. Maryland NOAA/NCEP/EMC: Kenneth Mitchell, Mike Ek, Youlong Xia, Dag Lohmann, Helin Wei, Curtis Marshall, Jesse Meng NASA/GSFC: Paul Houser, Brian Cosgrove, Charles Alonge, David Mocko Princeton U: Eric Wood, Justin Sheffield, Ming Pan NOAA/NWS/OHD: John Schaake, Qingyun Duan, Victor Koren Rutgers U: Alan Robock, Lifeng Luo NOAA/NCEP/CPC: W. Higgins, Wei Shi, Yun Fan, H. Van den Dool Kingtse Mo, Wanru Wu U. Maryland: R. Pinker NOAA/NSDIS: D. Tarpley U. Washington: Dennis Lettenmaier, Andy Wood, Ben Livneh U.S. Department of Agriculture (USDA): Eric Luebehusen
NLDAS Website Monitor Prediction NOAA/NCEP/EMC NLDAS Website: http://www.emc.ncep.noaa.gov/mmb/nldas NASA/GSFC NLDAS Website: http://ldas.gsfc.nasa.gov/nldas/
http://www.emc.ncep.noaa.gov/mmb/nldas http://disc.sci.gsfc.nasa.gov/hydrology/data-holdings Distribution of NLDAS Data 31 years (1979-2009), hourly temporal resolution, 1/8th degree spatial resolution, NLDAS region. Forcing data and outputs from four land models
Outline 1. Introduction 2. NLDAS phase 1 - NLDAS-1 3. NLDAS Phase 2 - NLDAS-2 4. Summary and Future Direction
NLDAS-1 Objective 1. Provide initial land state conditions for regional weather and climate prediction models in real-time that are superior to current methodologies 2. Provide framework to spin-up land states to real-time whenever land model is changed / updated and develop improved land surface model/parameterizations Method Run land model offline on the same grid and topography as the atmospheric model for sufficient spin-up period prior to using land model states in coupled atmospheric –hydrological model, validate Model output
Common forcing Soil and Vegetation Parameters Four Land surface models Development Development Model NLDAS Domain 1/8o spatial resolution Hourly temporal resolution model Evaluation Calibration Observations NLDAS Configuration
Common Forcing model Radar satellite
NLDAS Spin-up One year spin-up: Oct 1996 – Sep 1997 Spin-up test from Cosgrove et al. (2003) showed that in general, NLDAS models reach a state of rough equilibrium within the first 1 to 2 years. However, the NLDAS models need over 5-years to reach equilibrium for fine scales. Therefore, 1-year spin-up can eliminate initial effects on the simulation of subsequent period for large scale averaged regions. However, initial values have significant effects on NLDAS analysis at fine scales (i.e., 1/8o grid box).
Forcing Validation Validation sites: Oklahoma Mesonet and ARM/CART sites (Luo et al., JGR, 2003), SNOTEL sites (Pan et al., 2003) Oklahoma: very close to OBS SNOTEL: Underestimate more than 60% due to: (a) topographic effect and (b) snow undercatch (wind)
Evaluation of NLDAS Products Oklahoma Mesonet (circle) and ARM/CAT (triangle) sites Seasonal Cycle of Energy Fluxes Averaged over 24 ARM/CART site. Seasonal cycle validation (top right) and diurnal cycle validation (bottom left). Mosaic – larger LE and smaller H, VIC – smaller LE and larger H Energy Flux (Robock et al, JGR, 2003) The results found that soil heat capacity and aerodynamic conductance were two major factors to contribute these differences
Mean annual precipitation partitioning N: NOAH M: Mosaic S: SAC V: VIC +: OBS Water Fluxes (Lohmann et al., JGR, 2004) OBS uses USGS streamflow observation at the 1145 gauges over the continental U.S. Major conclusions: all four LSMs underestimated OBS over the northwest region; VIC model overestimated OBS in the southeast. Mosaic and SAC underestimated OBS for all regions. Simulation skills appear in the eastern part and western coast even though there are substantial inter-model differences. Mean annual relative bias (SIM-OBS)/OBS during OCT 1997 and SEP 1999 Nash-Sutcliffe efficiency for two-year daily sreamflow (1.0-perfect simulation, negative – no skill)
Robock et al, JGR, 2003 Oklahoma Mesonet 72-site average Oklahoma 72-site average Schaake et al., JGR, 2004 Illinois 17-site Average Soil Moisture and temperature Oklahoma hourly soil moisture and temperature validation – pretty good Illinois annual soil moisture validation – NOAH and SAC: pretty good; Mosaic and VIC- underestimation
Snowpack Evaluation Sheffield et al., JGR, 2003
Snowpack Evaluation Continued NW NW NC NE MI NA MI OH NC OI NE NA River Forecast Center (RFC) Northwest RFC Noah: small snow cover, early snow melt, large sublimation, and small albedo. VIC: close to IMS snow cover because of large albedo and small sublimation
Lessons from NLDAS-1 • Gauge precipitation errors, particularly in western mountainous region (topographic effect + snow undercatch due to wind) and spatial and temporal discontinuity of downward solar radiation • Noah cold season simulation • VIC evaporation underestimation and total runoff overestimation, particularly in the southeast • Mosaic and SAC evaporation overestimation and total runoff underestimation • Short spin-up period
Outline 1. Introduction 2. NLDAS phase 1 - NLDAS-1 3. NLDAS Phase 2 - NLDAS-2 4. Summary and Future Direction
NLDAS-2 Two modes: Monitoring and Prediction • Objective: • Support National Integrated Drought Information (NIDIS, U.S. Drought Monitor, U.S. Seasonal Drought Outlook) • Extend from 3-year NLDAS-1 to 31-year NLDAS-2 and add seasonal hydrologic forecast • Improve forcing data, model physical processes, and model parameters • Evaluate simulation skills using long-term in-situ and satellite retrieved products
NLDAS-2=PRISM, NLDAS-1=NLDAS Summer (APR-SEP) Winter (OCT-MAR) NLDAS Monitoring Forcing Improvement PRISM including the effect of topography on precipitation is added to NLDAS-2
Snow undercatch is not added to NLDAS-2 due to: (1) more research needs to be done and (2) undercatch corrected products have low confidence (Xia and Xu, Adv. Atmos. Sci., 2007) Forcing Improvement Precipitation
Forcing improvement Solar Radiation Discontinuity of GOES filling
Model Improvement NCEP Noah model – warm season Wei et al. (GRL, submitted, 2010) The Noah control version is upgraded to test version by (1) replacing constant leaf area index (LAI) treatment with seasonally and spatially varying LAI, (2) allowing a seasonally varying vertical profile of root density, (3) changing the function for the vapor-pressure deficit term in the canopy resistance, (4) changing the minimum stomatal resistance parameters for a few vegetation classes, (5) changing the upper threshold of soil moisture at which the vegetation feels a soil moisture deficit, (6) changing the treatment for the diurnal variation of surface albedo, and (7) changing the single parameter in the formulation for roughness length for heat (to increase the daytime aerodynamic conductance).
Model Improvement NCEP Noah Model – Cold Season
NLDAS-1 NLDAS-1 NLDAS-2 NLDAS-2 Model Improvement SAC (left) and VIC (right) Mean annual relative bias SIM-OBS/OBS (OCT 1979 – SEP 2007) different model version and the same forcing
EM Comparsion of Model Results 28-year mean annual runoff ratio Oct 1979 – Sep 2007
Comparison of Model Results 28-year Mean annual evaporation for four models an their spread
Net radiation Sensible heat Latent heat Residual Ground Heat Energy Budget Analysis 28-year mean area-averaged continental U.S.
Precipitation Evaporation Total runoff Water storage change Water Budget Analysis 28-year mean area-averaged continental U.S.
Ensemble mean Mosaic OBS Noah VIC radiation Validation of Energy Fluxes at AmeriFlux Stations
Streamflow Validation Mean annual observed (in red) and simulated runoff ratios for the 961 study basins over the US, as well as for subsets which fall in three sub-regions. Values are for the period from 1 October 1979 to 30 September 2007 28-year Mean observed USGS streamflow for 961 basins
Streamflow Validation 28-year mean annual relative biases over the 961 basins Noah Overestimated Mosaic Underestimated SAC and VIC close to OBS Four-model ensemble mean Closet to OBS
Cumulative Density Function (CDF) of Nash-Sutcliffe Efficiency (NSE) for 961 basins and different time scales
Correlation between observed and simulated monthly mean streamflow from Oct 1979 to Sep 2007 Mean seasonal cycle is removed from monthly mean time series. High correlation appears in the east and west coast. All models except for VIC fails to simulate interior states, in particular western mountains. The reason is that VIC considered snow-band and the other models did not.
SAC Noah Mosaic VIC Snow Water Equivalent (SWE) comparison
OBS –blackNoah – redMosaic – green SAC – blue VIC - orange Correlation Coefficient: 0.770.62 0.76 0.75 Correlation Coefficient:0.820.63 0.78 0.76 Top 1m and 2m Soil Moisture Validation in Illinois
Application of NLDAS-2 Products An Example to support NIDIS
1988 U.S. Drought July Total Column Soil Moisture Anomaly (mm)
1988 U.S. Drought July Total Runoff (mm/month) and Streamflow Anomaly (m3/s) Streamflow Total Runoff
4 U.S. Drought Snapshots Total Column Soil Moisture Percentile 1996 2002 2007 1988 MM Noah Mosaic SAC VIC Drought book chapter on NLDAS, Sheffield et al, 2010
NLDAS Real-time Monitoring at NCEP Current Real-time Monitoring Ensemble Mean NCEP/Noah NASA/Mosaic OHD/SAC Princeton/VIC