Download
1 / 1

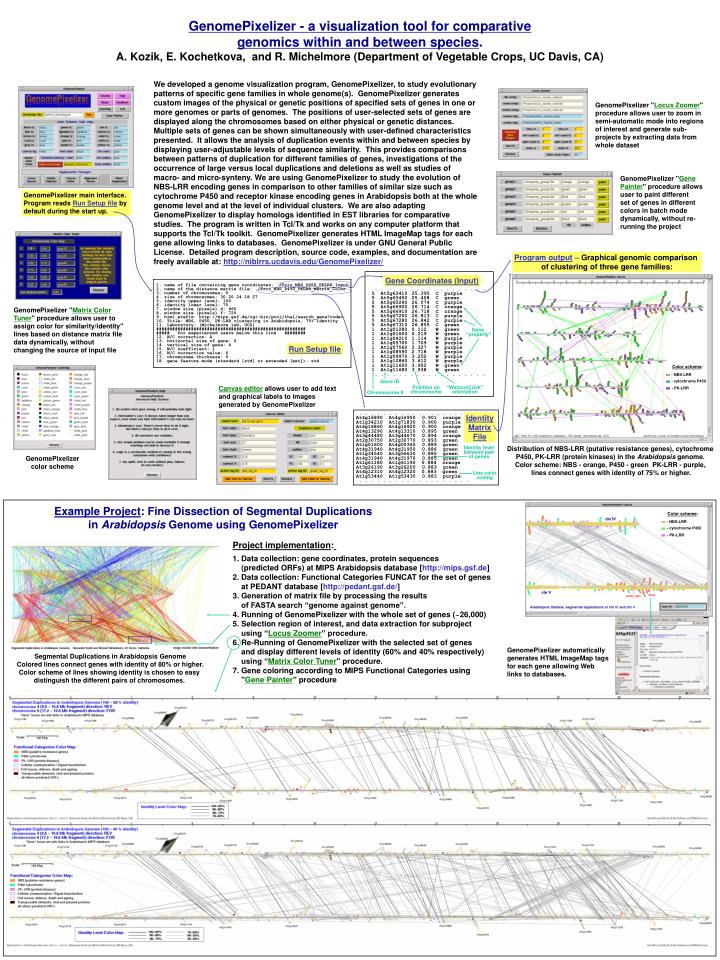
E N D
1. name of file containing gene coordinates: ./Trio_NBS_P450_PKLRR_Input2. name of the distance matrix file: ./Trio_NBS_P450_PKLRR_Matrix_Color3. number of chromosomes: 54. size of chromosomes: 30 20 24 18 27 5. identity upper level: 1006. identity lower level: 757. window size (pixels) X: 9608. window size (pixels) Y: 7209. html prefix: http://mips.gsf.de/cgi-bin/proj/thal/search_gene?code=10. Title: NBS, P450, PK-LRR clustering in Arabidopsis, 75% identity11. Laboratory: (Michelmore lab, UCD)############################################################# for experienced users below this line ########12. W/C correction: A13. horizontal size of gene: 914. vertical size of gene: 415. W/C coefficient: 116. W/C correction value: 617. chromosome thickness: 518. gene feature mode (standard [std] or extended [ext]): std Color scheme: - NBS-LRR - cytochrome P450 - PK-LRR Gene ID GenomePixelizer - a visualization tool for comparative genomics within and between species.A. Kozik, E. Kochetkova, and R. Michelmore (Department of Vegetable Crops, UC Davis, CA) We developed a genome visualization program, GenomePixelizer, to study evolutionary patterns of specific gene families in whole genome(s). GenomePixelizer generates custom images of the physical or genetic positions of specified sets of genes in one or more genomes or parts of genomes. The positions of user-selected sets of genes are displayed along the chromosomes based on either physical or genetic distances. Multiple sets of genes can be shown simultaneously with user-defined characteristics presented. It allows the analysis of duplication events within and between species by displaying user-adjustable levels of sequence similarity. This provides comparisons between patterns of duplication for different families of genes, investigations of the occurrence of large versus local duplications and deletions as well as studies of macro- and micro-synteny. We are using GenomePixelizer to study the evolution of NBS-LRR encoding genes in comparison to other families of similar size such as cytochrome P450 and receptor kinase encoding genes in Arabidopsis both at the whole genome level and at the level of individual clusters. We are also adapting GenomePixelizer to display homologs identified in EST libraries for comparative studies. The program is written in Tcl/Tk and works on any computer platform that supports the Tcl/Tk toolkit. GenomePixelizer generates HTML ImageMap tags for each gene allowing links to databases. GenomePixelizer is under GNU General Public License. Detailed program description, source code, examples, and documentation are freely available at: http://niblrrs.ucdavis.edu/GenomePixelizer/ GenomePixelizer "Locus Zoomer" procedure allows user to zoom in semi-automatic mode into regions of interest and generate sub-projects by extracting data from whole dataset GenomePixelizer "Gene Painter" procedure allows user to paint different set of genes in different colors in batch mode dynamically, without re-running the project GenomePixelizer main interface. Program reads Run Setup file by default during the start up. Program output– Graphical genomic comparison of clustering of three gene families: Gene Coordinates (Input) . . . . . . . . . . . . . . . . . . . 5 At5g63410 25.395 C purple5 At5g63450 25.408 C green5 At5g65240 26.074 C purple5 At5g66900 26.714 C orange5 At5g66910 26.718 C orange5 At5g67200 26.813 C purple5 At5g67280 26.842 C purple5 At5g67310 26.855 C green1 At1g01280 0.112 W green1 At1g01600 0.219 W green1 At1g04210 1.114 W purple1 At1g05700 1.709 W purple1 At1g07560 2.327 W purple1 At1g08590 2.718 W purple1 At1g09970 3.252 W purple1 At1g10860 3.612 W purple1 At1g11600 3.902 W green1 At1g11680 3.938 W green . . . . . . . . . . . . . . . . . . . GenomePixelizer "Matrix Color Tuner" procedure allows user to assign color for similarity/identity" lines based on distance matrix file data dynamically, without changing the source of input file Gene “property” Run Setup file Canvas editor allows user to add text and graphical labels to images generated by GenomePixelizer Position on chromosome “Watson/Crick” orientation Chromosome # . . . . . . . . . . . . . . . . . . . At4g16890 At4g16950 0.901 orangeAt1g34210 At1g71830 0.900 purpleAt4g16860 At4g16920 0.900 orangeAt4g13290 At4g13310 0.895 greenAt3g44480 At3g44670 0.894 orangeAt2g30750 At2g30770 0.893 greenAt1g01600 At4g00360 0.889 greenAt4g31940 At4g31950 0.886 greenAt1g34540 At3g56630 0.885 greenAt4g31940 At4g31970 0.885 greenAt1g61180 At1g61190 0.884 orangeAt3g26190 At3g26200 0.883 greenAt4g12310 At4g12320 0.883 greenAt1g53440 At1g53430 0.883 purple . . . . . . . . . . . . . . . . . . . Identity Matrix File Distribution of NBS-LRR (putative resistance genes), cytochrome P450, PK-LRR (protein kinases) in the Arabidopsis genome. Color scheme: NBS - orange, P450 - green, PK-LRR - purple, lines connect genes with identity of 75% or higher. Identity level between pair of genes GenomePixelizer color scheme Line color coding Example Project: Fine Dissection of Segmental Duplications in Arabidopsis Genome using GenomePixelizer Color scheme: - NBS-LRR - cytochrome P450 - PK-LRR Project implementation: 1. Data collection: gene coordinates, protein sequences (predicted ORFs) at MIPS Arabidopsis database [http://mips.gsf.de] 2. Data collection: Functional Categories FUNCAT for the set of genes at PEDANT database [http://pedant.gsf.de/] 3. Generation of matrix file by processing the results of FASTA search “genome against genome”. 4. Running of GenomePixelizer with the whole set of genes (~26,000) 5. Selection region of interest, and data extraction for subproject using “Locus Zoomer” procedure. 6. Re-Running of GenomePixelizer with the selected set of genes and display different levels of identity (60% and 40% respectively) using “Matrix Color Tuner" procedure. 7. Gene coloring according to MIPS Functional Categories using "Gene Painter" procedure GenomePixelizer automatically generates HTML ImageMap tags for each gene allowing Web links to databases. Segmental Duplications in Arabidopsis GenomeColored lines connect genes with identity of 80% or higher. Color scheme of lines showing identity is chosen to easy distinguish the different pairs of chromosomes.