Download
1 / 1
10 likes | 147 Vues
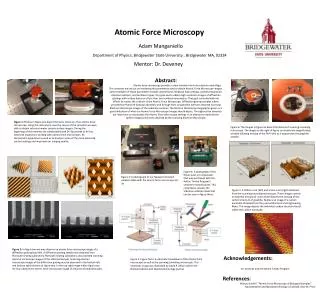
Atomic Force Microscopy of DNA Constructs. 582 nt. 570 nt. 2008 nt. Figure 1. Diagram of director strand showing the 582 and 2008 nucleotide regions flanking the six repeats. Figure 3. Repeat section with block structures. Q. Q. β β β β β β.

E N D
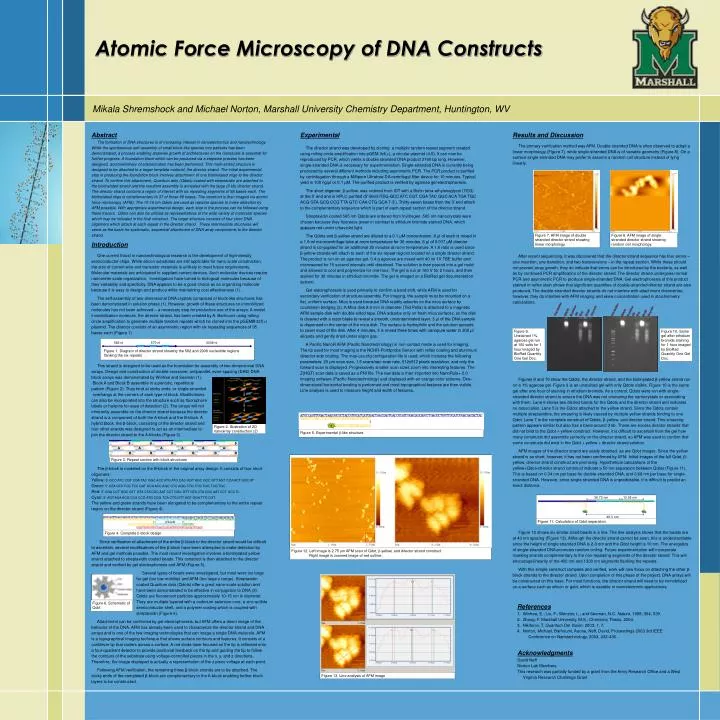
Atomic Force Microscopy of DNA Constructs 582 nt 570 nt 2008 nt Figure 1. Diagram of director strand showing the 582 and 2008 nucleotide regions flanking the six repeats Figure 3. Repeat section with block structures Q Q ββββββ A A A A A A B B B B B B Figure 7. AFM image of double stranded director strand showing linear morphology. Figure 8. AFM image of single-stranded director strand showing random coil morphology. Figure 2. Illustration of 2D nanoarray construction (2) Q Figure 5. Experimental β-like structure. 36.72 nm 12.58 nm 49.3 nm Figure 4. Complete β-block design Figure 11. Calculation of Qdot separation. Figure 12. Left image is 2.75 μm AFM scan of Qdot, β-yellow, and director strand construct. Right image is zoomed image of red outline. Figure 6. Schematic of Qdot Figure 13. Line analysis of AFM image Mikala Shremshock and Michael Norton, Marshall University Chemistry Department, Huntington, WV AbstractThe formation of DNA structures is of increasing interest in nanoelectronics and nanotechnology. While the spontaneous self-assembly of small block-like species into patterns has been demonstrated, a process enabling stepwise growth of architectures on the nanoscale is essential for further progress. A foundation block which can be produced via a stepwise process has been designed, and preliminary characterization has been performed. This multi-strand structure is designed to be attached to a larger template material, the director strand. The initial experimental step in producing the foundation block involves attachment of one biotinylated oligo to the director strand. To confirm this attachment, Quantum dots (Qdots) coated with streptavidin are attached to the biotinylated strand and the resultant assembly is annealed with the large (3 kb) director strand. The director strand contains a region of interest with six repeating segments of 95 bases each. The biotinylated oligo is complementary to 37 of those 95 bases. The construct is then imaged via atomic force microscopy (AFM). The 10-15 nm Qdots are used as reporter species to make detection by AFM possible. With appropriate experimental design, each step in the process can be followed using these tracers. Qdots can also be utilized as representatives of the wide variety of molecular species which may be included in the final construct. The target structure consists of four short DNA oligomers which attach at each repeat in the director strand. These intermediate structures will serve as the basis for systematic, sequential attachment of DNA array components to the director strand. Introduction One current thrust in nanotechnological research is the development of high-density semiconductor chips. While silicon substrates are still applicable for nano-scale construction, the size of current wire and transistor materials is unlikely to meet future requirements. Molecular materials are anticipated to supplant current devices. Such molecular devices require nanometer scale organization. Investigators have turned to biological molecules because of their variability and specificity. DNA appears to be a good choice as an organizing molecule because it is easy to design and produce while maintaining cost effectiveness (1). The self-assembly of two-dimensional DNA crystals composed of block-like structures has been demonstrated in solution phase (1). However, growth of these structures on immobilized molecules has not been achieved – a necessary step for productive use of the arrays. A model immobilization molecule, the director strand, has been created by A. Barhoumi using rolling circle amplification to generate multiple tandem repeats which he cloned into the pGEM® 3zf(+) plasmid. The director consists of an asymmetric region with six repeating sequences of 95 bases each (Figure 1) This strand is designed to be used as the foundation for assembly of two-dimensional DNA arrays. Design and construction of double-crossover, antiparallel, even-spacing (DAE) DNA block arrays was demonstrated by Winfree and Seeman (1). Block A and Block B assemble in a periodic, repetitious pattern (Figure 2). They bind at sticky ends, or single-stranded overhangs at the corners of each type of block. Modifications can also be incorporated into the structure such as fluorophore labels or hairpins for ease of detection (2). The arrays will not inherently assemble on the director strand because the director strand is a component of both the A-block and the B-block. A hybrid block, the β-block, consisting of the director strand and four other strands was designed to act as an intermediate to join the director strand to the A-blocks (Figure 3). The β-block is modeled on the B-block in the original array design. It consists of four short oligomers: Yellow: 5’-GCC ATC CGT CGA TAC GGC ACC ATG ATG CAC GGT AGC GCC GTT AGT CCA ACT GGC ATGreen: 5’-GTA GTA TCG TCC GAT GCA ACC AGC GTC AGG CTG CTG TGG TCG TGCRed: 5’-CGA CCT GGC GTT GTA CTA CGC AAT CCT GGC GTT GTA CTA CGC AAT CCT GCC GCyan: 5’-AGT ACA ACG CCA CCG ATG CGG TCA CTG GTT AGT GGA TTG CGT.The yellow and green strands have been elongated to be complementary to the entire repeat region on the director strand (Figure 4). Since verification of attachment of the entire β-block to the director strand would be difficult to ascertain, several modifications of the β-block have been attempted to make detection by AFM and gel methods possible. The most recent investigation involves a biotinylated yellow strand attached to streptavidin coated beads. This construct is then attached to the director strand and verified by gel electrophoresis and AFM (Figure 5). Several types of beads were investigated, but most were too large for gel (too low mobility) and AFM (too large z range). Streptavidin coated Quantum dots (Qdots) offer a great nano-scale solution and have been demonstrated to be effective in conjugation to DNA (3). Qdots are fluorescent particles approximately 10-15 nm in diameter. They are multiple layered with a cadmium-selenium core, a zinc-sulfide semiconductor shell, and a polymer coating which is coupled with streptavidin (Figure 6). Attachment can be confirmed by gel electrophoresis, but AFM offers a direct image of the behavior of the DNA. AFM has already been used to characterize the director strand and DNA arrays and is one of the few imaging technologies that can image a single DNA molecule. AFM is a topographical imaging technique that shows surface contours and features. It consists of a cantilever tip that rasters across a surface. A red diode laser focused on the tip is reflected onto a four-quadrant detector to provide positional feedback on the tip and guiding the tip to follow the contours of the substrate using voltage-controlled piezos in the x, y, and z directions. Therefore, the image displayed is actually a representation of the z piezo voltage at each point. Following AFM verification, the remaining three β-block strands are to be attached. The sticky ends of the completed β-block are complementary to the A-block enabling further block layers to be constructed. ExperimentalThe director strand was developed by cloning a multiple tandem repeat segment created using rolling circle amplification into pGEM 3zf(+), a circular plasmid (4,5). It can now be reproduced by PCR, which yields a double stranded DNA product 3160 bp long. However, single-stranded DNA is necessary for experimentation. Single-stranded DNA is currently being produced by several different methods including asymmetric PCR. The PCR product is purified by centrifugation through a Millipore Ultrafree-DA centrifugal filter device for 10 minutes. Typical yield is 100 ng/μl or 0.1 μM. The purified product is verified by agarose gel electrophoresis. The short oligomer, β-yellow, was ordered from IDT with a Biotin tetra-ethyleneglycol (TEG) at the 5’ end and is HPLC purified (5'-BiotinTEG-GCC ATC CGT CGA TAC GGC ACA TGA TGC ACG GTA GCG CCG TTA GTC CAA CTG GCA T-3’). Thirty-seven bases from the 3’ end attach to the complementary sequence which is part of each repeat section of the director strand. Streptavidin coated 565 nm Qdots are ordered from Invitrogen. 565 nm nanocrystals were chosen because they fluoresce green in contrast to ethidium bromide stained DNA, which appears red under ultraviolet light. The Qdots and β-yellow strand are diluted to a 0.1 μM concentration. 6 μl of each is mixed in a 1.5 ml microcentrifuge tube at room temperature for 30 minutes. 6 μl of 0.017 μM director strand is conjugated for an additional 30 minutes at room temperature. A 1:6 ratio is used since β-yellow strands will attach to each of the six repeat regions located on a single director strand. The product is run on an agarose gel. 0.4 g agarose are mixed with 40 ml 1X TBE buffer and microwaved for 15 second intervals until dissolved. The solution is then poured into a gel mold and allowed to cool and polymerize for one hour. The gel is run at 100 V for 2 hours, and then stained for 30 minutes in ethidium bromide. The gel is imaged on a BioRad gel documentation system. Gel electrophoresis is used primarily to confirm a band shift, while AFM is used for secondary verification of structure assembly. For imaging, the sample must be mounted on a flat, uniform surface. Mica is used because DNA readily adsorbs on the mica surface by counterion bridging (2). A Mica disk 9.9 mm in diameter (Ted Pella) is attached to a magnetic AFM sample disk with double-sided tape. DNA adsorbs only on fresh mica surfaces, so the disk is cleaved with a razor blade to reveal a smooth, uncontaminated layer. 3 μl of the DNA sample is dispensed in the center of the mica disk. The surface is hydrophilic and the solution spreads to cover most of the disk. After 4 minutes, it is rinsed three times with nanopure water in 200 μl aliquots and gently dried under argon gas. A Pacific NanoR AFM (Pacific Nanotechnology) in non-contact mode is used for imaging. The tip used for most imaging is the NCHR-Pointprobe Sensor with reflex coating and aluminum detector side coating. The mas-osc.cfg configuration file is used, which includes the following parameters: 20 μm scan size, 1.5 scans/sec scan rate, 512x512 pixels resolution, and only the forward scan is displayed. Progressively smaller scan sizes zoom into interesting features. The Z(HGT) scan data is saved as a PNI file. The raw data is then imported into NanoRule+ 2.0 imaging software (Pacific Nanotechnology) and displayed with an orange color scheme. One-dimensional horizontal leveling is performed and most topographical features are then visible. Line analysis is used to measure height and width of features. Results and Discussion The primary verification method was AFM. Double stranded DNA is often observed to adopt a linear morphology (Figure 7), while single-stranded DNA is of variable geometry (Figure 8). On a surface single stranded DNA may prefer to assume a random coil structure instead of lying linearly. After recent sequencing, it was discovered that the director strand sequence has four errors – one insertion, one transition, and two transversions – in the repeat section. While these should not prevent array growth, they do indicate that errors can be introduced by the bacteria, as well as by continued PCR amplification of the director strand. The director strand undergoes normal PCR and asymmetric PCR to produce single-stranded DNA. Gel electrophoresis of this product stained in reflex stain shows that significant quantities of double-stranded director strand are also produced. The double-stranded director strands do not interfere with attachment chemistries; however, they do interfere with AFM imaging and skew concentration used in stoichiometry calculations. Figures 9 and 10 show the Qdots, the director strand, and the biotinylated β-yellow strand run on a 1% agarose gel. Figure 9 is an unstained gel with only Qdots visible. Figure 10 is the same gel after one hour of staining in ethidium bromide. As a control, Qdots were run with single-stranded director strand to ensure the DNA was not ensnaring the nanocrystals or associating with them. Lane 6 shows two distinct bands for the Qdots and the director strand and indicates no association. Lane 5 is the Qdots attached to the yellow strand. Since the Qdots contain multiple streptavidins, the smearing is likely caused by multiple yellow strands binding to one Qdot. Lane 7 is the complete construct of Qdots, β-yellow, and director strand. This smearing pattern appears similar but also has a band around 3 kb. These are excess director strands that did not bind to the Qdot + yellow construct. However, it is difficult to ascertain from the gel how many constructs did assemble correctly on the director strand, so AFM was used to confirm that some constructs did exist in the Qdot + yellow + director strand solution. AFM images of the director strand are easily obtained, as are Qdot images. Since the yellow strand is so short, however, it has not been confirmed by AFM. Initial images of the full Qdot, β-yellow, director strand construct are promising. Hypothetical calculations of the yellow+Qdot+director strand construct indicate a 50 nm separation between Qdots (Figure 11). This is based on 0.34 nm per base for double-stranded DNA, and 0.68 nm per base for single-stranded DNA. However, since single-stranded DNA is unpredictable, it is difficult to predict an exact distance. Figure 12 shows six similar sized beads in a line. The line analysis shows that the beads are at 40 nm spacing (Figure 13). Although the director strand cannot be seen, this is understandable since the height of single stranded DNA is 2-3 nm and the Qdot height is 10 nm. The energetics of single-stranded DNA promotes random coiling. Future experimentation will incorporate masking strands complementary to the non-repeating segments of the director strand. This will encourage linearity of the 400 nm and 1300 nm segments flanking the repeats. With this simple construct complete and verified, work will now focus on attaching the other β-block strands to the director strand. Upon completion of this phase of the project, DNA arrays will be constructed on this base. For most functions, the director strand will need to be immobilized on a surface such as silicon or gold, which is useable in nanoelectronic applications. Figure 9. Unstained 1% agarose gel run at 100 volts for 1 hour imaged by BioRad Quantity One Gel Doc. Figure 10. Same gel after ethidium bromide staining for 1 hour imaged by BioRad Quantity One Gel Doc. • References • Winfree, E.; Liu, F.; Wenzler, L.; and Seeman, N.C. Nature, 1998, 394, 539. • Zhang, F. Marshall University. M.S., Chemistry Thesis. 2004. • Nikiforov, T. Quantum Dot Vision. 2003, 1, 7. • Norton, Michael, Barhoumi, Aoune, Neff, David, Proceedings 2003 3rd IEEE • Conference on Nanotechnology, 2003, 432-436. Acknowledgments David Neff Norton Lab Members This research was partially funded by a grant from the Army Research Office and a West Virginia Research Challenge Grant