Download
1 / 13
140 likes | 298 Vues
Teaching Climate Change Using Geospatial Technologies. October 12, 2012. What are Geospatial Technologies?.

E N D
Teaching Climate Change Using Geospatial Technologies October 12, 2012
What are Geospatial Technologies? • Geospatial technologies or Geospatial Information Systems (GIS) provide the ability to manipulate geographic/spatial data using desktop and web-based intelligent mapping tools. They provide a visual interface where the user can interact with the map to determine attributes, or select a database record and view it on a map. GIS includes many spatial analysis toolssuch as: • Global Positioning System (GPS) - locating device based on orbiting satellites and triangulation • Spatial Database Technologies - ability to store spatial/coordinate information natively in the database • Automatic Vehicle Locator - tracking of GPS-enabled vehicles on a map in real-time (e.g. State Police vehicles)
Why Use GIS Tools? • Rising carbon and greenhouse gas (GHG) levels are causing global environmental changes, such as rising sea levels and temperatures, changing precipitation patterns, and extreme weather. • These changes have a variety of impacts, from flooding to drought to disease outbreaks and chronic food and water shortages. In turn, these impacts have many possible geopolitical implications, including political instability, rises in extremism, epidemics, and humanitarian crises.
How are GIS Tools Used? • Geospatial technologies provide spatial analysis that helps inform decision-making and policy-making by helping people understand the potential impacts. • Geospatial tools help us measure, monitor, and hopefully adapt to the effects of climate change. • Geospatial technologies can enhance the analysis and scenario planning exercises that will ultimately help us to design and prioritize both mitigation and adaptation efforts.
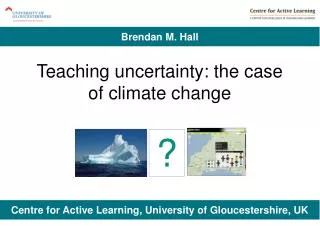
Why Use Geospatial Technologies to Teach Climate Change? • People may be reluctant to act on climate change because the effects of climate change are long-term, dispersed, and cross many kinds of boundaries. Everyone isn’t able to see the melting ice caps in person, but imagery available to them via geospatial technologies provides the next best thing! • Geospatial technologies not only help people adapt to climate change in the physical or policy sense, but to the idea that climate change is actually happening. It helps present evidence to aid in understanding the big issues, like the growing desertification and shifting agricultural areas in many areas around the world, and how those issues affect them personally. http://www.boozallen.com/insights/ideas/geospatial/episode4/details/49289514
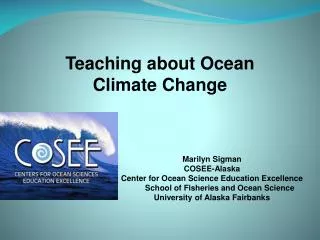
Climate Change & Human Health • This project uses an interactive geospatial globe called CHANGE Viewer, to view and access climate and human related datasets. • This tool is a customized and enhanced NASA World Wind portal that can be launched from any computer with an internet connection and Adobe Flash.
Climate Change & Human Health • Click the link above and launch the Change Viewer • Food Security, Water Resources and Natural Disasters: Cyclones are already available • Try comparing access to waterto the corruption measure. Click Data Library, SEDAC
Climate Change & Human Health • Spend 15 minutes exploring the variables. • Share with the group two variables you explored and a correlation you may have observed. • How can you use this to discuss Climate Change in your class?
The Cryosphere, GIS & Climate • Since 1978, satellites have monitored sea ice growth and retreat, and they have detected an overall decline in Arctic sea ice. The rate of decline steepened after the turn of the twenty-first century. • In September 2002, the summer minimum ice extent was the lowest it had been since 1979. Although the September 2002 low was only slightly below previous lows (from the 1990s), it was the beginning of a series of record or near-record lows in the Arctic.
The Cryosphere, GIS & Climate Ocean Currents Causing Antarctic Ice Loss This animation shows the circulation of ocean currents around the western Antarctic ice shelves. The shelves are indicated by the rainbow color; red is thicker (>550m), while blue is thinner (<200m). These shelves are being melted from the underside by warm ocean currents. Article Literacy Lab Template
GIS, Migration & Climate • GIS Activities: Determining initial and ending coordinates for each animal. Comparing preferred tracklines with surface ocean currents using the ESRT • Gray Whale Migration • Additional Reading from the Climate Institute: Whales: Even Giants Aren’t Safe • Article Review Guidelines • Article Review Rubric
Hydroelectric Power • How Hydroelectric Dams Work • Articles about Hydroelectric Power • Hydroelectric Power Persuasive Essay • ELI Hydroelectric Power Google Lab • ELI Hydroelectric Power Field Guide
Resources for Using Geospatial Technologies to Teach Climate Change NASA TV http://www.nasa.gov/multimedia/videogallery/index.html ELI @ Lehigh University: Instructional http://www.ei.lehigh.edu/eli/energy/overview.html ELI Resources http://www.ei.lehigh.edu/eli/energy/resources.html#gis NASA Earth Observatory: World of Change http://earthobservatory.nasa.gov/Features/WorldOfChange/ Climate Change and Human Health: Change Viewer http://www.climatechangehumanhealth.org SERC: teaching About Climate Change http://serc.carleton.edu/NAGTWorkshops/climatechange/index.html Maryland’s Chesapeake and Coastal Service http://www.dnr.state.md.us/map_template/coastalmaps/coastal_atlas_shorelines.html Geospatial Revolution Project: Episode 4 http://www.boozallen.com/insights/ideas/geospatial/episode4/details/49289514