Download
1 / 37
370 likes | 508 Vues
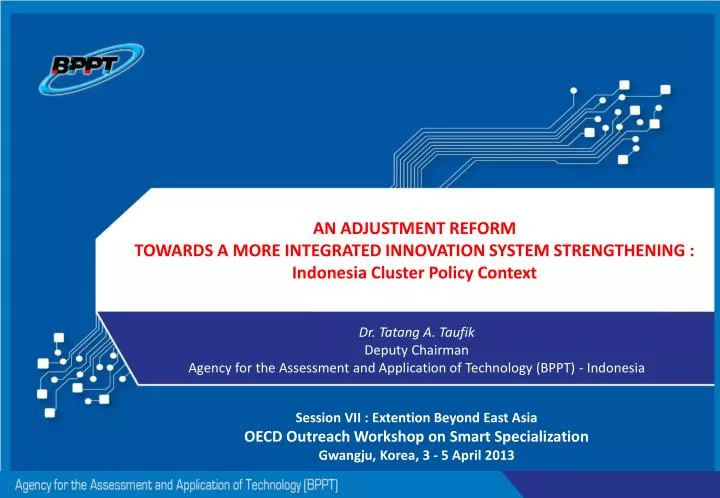
An adjustment Reform towards a more integrated innovation system strengthening : Indonesia Cluster Policy Context. Dr. Tatang A. Taufik Deputy Chairman Agency for the Assessment and Application of Technology (BPPT) - Indonesia. Session VII : Extention Beyond East Asia

E N D
An adjustment Reformtowards a more integrated innovation system strengthening : Indonesia Cluster Policy Context Dr. Tatang A. TaufikDeputy ChairmanAgency for the Assessment and Application of Technology (BPPT) - Indonesia Session VII : Extention Beyond East Asia OECD Outreach Workshop on Smart Specialization Gwangju, Korea, 3 - 5 April 2013
1 INTRODUCTION 2 3 TOWARDS INTEGRATED INNOVATION SYSTEM 4 CONCLUDING REMARKS OUTLINE INDUSTRIAL CLUSTER DEVELOPMENT
1 INTRODUCTION 2 3 TOWARDS INTEGRATED INNOVATION SYSTEM 4 CONCLUDING REMARKS OUTLINE INDUSTRIAL CLUSTER DEVELOPMENT
COUNTRY BACKGROUND • South East Asia, Equator, average 27ºC, 90% humidity • Archipelago (stretched 5,200 km East to West, 67% sea) • 1,904,569 square km landmass (13,466islands ~ 400 inhabited, main islands : Java, Sumatera, Kalimantan, Sulawesi, Papua, Maluku, Nusa Tenggara) • ± 108,000 km coastline • ± 257,516,167 people (est. 2012,4th most populated country, ~ 60% in Java) • ± 300 ethnic groups (major ethnics : Javanese, Sundanese, Melayu,Bugis, Balinese) • 16th largest economy.
Current Government DevelopmentPolicy (2010-2014) 11 National priorities Bureaucracy Reform and Governance Education Health Poverty reduction Food security Infrastructure Investment and business climate Energy Environment and disaster management Marginal areas, outer islands/regions, post-conflict ridden areas Culture, creativity and technology innovation 15 President’s specific priorities Eradication of court law’s “mafia” Revitalization of defense industry Terrorism prevention Nation-wide electricity availability Increased food production and strengthened food security Revitalization of fertilizer and sugar factories Regulatory improvement in land-use and regional planning Infrastructure development Financial/credit support for SMEs amounted to ~US$ 200 Mio/year Financing and investment scheme Reformulation of Indonesia’s contribution to climate change and environmental challenges Public health reform Harmonization between education and employment Disaster mitigation and management Central and provincial/district governments synergy.
NATIONAL POLICY ON STI : Innovation System & INDUSTRIAL DEVELOPMENT • MOI, MOSME & others in industrial cluster related projects; BPPT’s involvement since early 2000 in “industrial cluster & innovation system approaches.” • PERISKOP study - 2001, BMBF – MRT • Act (17/2007) : National Long Term Development Plan 2005 – 2025 (includes strengthening the National Innovation System/NIS to support knowledge-based economy development) • National Coordination Meeting on Research and Technology, 2008 • Related Presidential Regulations : • 28/2008 : National Industrial Policy • 5/2010 : National Medium Term Development Plan, 2010-2014 • 32/2011 : Master Plan for the Acceleration and Extention of the Indonesian Economic Development (MP3EI) 2011 - 2025.
1 INTRODUCTION 2 3 TOWARDS INTEGRATED INNOVATION SYSTEM 4 CONCLUDING REMARKS OUTLINE INDUSTRIAL CLUSTER DEVELOPMENT
NATIONAL INDUSTRIAL POLICY Source : Presidential Regulation 28/2008 on the National Industrial Policy a. Vision 2025 ‘’Indonesia to be a Strong Industrial Country in the World’’ b. Missions • Vehicles to fulfill people’s needs • Dynamic factors for the economic growth • Multipliers to productive business activities • Vehicles to advance the national technologies • Vehicles to modernize people’s life • Supporting pillars for the country’security and defence • ‘Main/focal points’ for sustainable industrial development c. Goals • Manufacturing industries achieve the world class industries • Balanced contributions of SMIs and LIs to GDP • Strong networking amongst SMIs and LIs, and international industries.
NATIONAL INDUSTRIAL DEVELOPMENT : OBJECTIVES Midterm Objectives Longterm Objectives 1. Able to provide added value to the economy and to absorb labors. 2. Able to lead in domestic markets and to increase exports. Industrial development consistent with the sustainable development concept, on the basis of : Economic development, Social development, and Environmental development. 3. Able to support infrastructure sectors. Able to contribute to the national technology mastery. 5. Able to enhance the industrial structure deepening and to diversify the production varieties. 6. Grow towards outside Java.
NATIONAL INDUSRIAL DEVELOPMENT GOALS Midterm Longterm Solved problems and finished industrial revitalization , consolidation, and restructuring programs, of those influenced by the crisis and disasters Strengthened manufacturing industry to become world class industry Strengthened networking amongst SMIs and large industries and the world industries. Growing industries capable of providing siginficant job creations Processed regional natural resource potentials to become processed products Enhanced industrial competitiveness to fulfill domestic needs and exports Balanced contributions of SMIs and LIs to GDP Increased potential industries to be the progressing powersfor the future industrial growth Developed SMIs, especially medium industries twice faser than that of small industries
FUTURE ‘MAIN/FOCAL POINT’ INDUSTRIES REGIONAL INDUSTRY CORE COMPETENCE BASIC MANUFACTURING INDUSTRIES PETROCHEMICALS CEMENT STEEL ETC TEXTILE-TP FOOTWEAR ELECTRONICS ETC CAPITAL GOODS INDUSTRIES COMPONENT INDUSTRIES (SME BASIS) RENEWABLE NAT. RESOURCES NON RENEWABLE NAT. RESOURCES HUMAN RESOURCES RESEARCH & DEVELOPMENT CREATIVITY NATIONAL INDUSTRIAL STRUCTURE AGRO-INDUSTRIES ICT INDUSTRIES TRANSPORTATION INDUSTRIES
NATIONAL INDUSTRIAL DEVELOPMENT STRATEGY • Industrial cluster approach is adopted in industrial development in order to realize the national industrial vision 2025 TOP DOWN Development of 35 Priority Industrial Clusters selected based on the national capabilities to compete in the domestic and international markets. Development of processing industries for regional products towards regional core competency (distinctive competence) BOTTOM UP
APPROACH I TOP-DOWN POLICY: PRIORITY INDUSTRIES • To have a more focused industrial development, priority industries were selected in expectation to be successfully supported to achive industrial development goals • Those industries may bring along other industries to grow • Priority industries were selected based on : • their international competitiveness potentials, and • future potentials to grow (the coverage of area, people involved, natural resources to be used) • International competitiveness potentials measured based on : • Supply(15 parameters) and • Demand(8parameters) • from 365 industries(ISIC 5 digits), had been selected 35priority industries with total output of 78%and total export of 83%. In 2009, 35 Minister of Industry’s Regulations on the Roadmap for the Development of Priority Industrial Clusters had been issued
ARRANGEMENT OF THE PRIORITY INDUSTRIAL CLUSTERS Electronics& ICT • Electronics • Telecommunication • Computersand Peripherals Supporting Industries for Creative Industries Software & Multimedia Content Fashion Crafts & Art Products Focus Transportation 35priority industries of 365 industries, with: • total output 78% • total export 83% Certain SMIs • Automotive Vehicles • Ships • Aerospace • Railways • Gemstones and Jewelry • Salt • Pottery & Decorative Ceramics • Essential Oils • Snacks Basic Manufacturing Industries Agro-Industries • Basic Material Industries (steel, cement, petrochemicals, ceramics) • Machinery Industries (electrical machinery & electrical equipment, general equipment) • Labor Intensive Manufacturing Industries (textile & textile products, footwear) • Tobacco Products • Fruit Processing • Furniture • Fish Processing • Paper • Milk Processing • CPO Processing • Rubber and Rubber Products • Cocoa • Coconut Processing • Coffee Processing • Sugar Notes : 10 clusters in MTDP 2005 - 2009: (1) food and drinks; (2) marine product processing; (3) textile and textile products; (4) footwear; (5) CPO; (6) Wood products (including rattan and bamboo); (7) rubber and rubber products; (8) pulp and paper; (9) electrical machinery and electrical equipment; (10) petrochemical.
Develop regional core competence through the development of processing industries for regional competitive products APPROACH II BOTTOM UP POLICY: Development of Regional Core Competence Have been identified industrial core competence in several regencies/cities Have been identified regional competitive products of each province, agreed to be supported with the local governments Provincies Up toDecember2010 18Minister of Industry’s Regulations on the Roadmapfor the Development of Province’s Competitive Products had been issued
MAP OF DEVELOPMENT OF PROVINCE’S CORE PRODUCT PROCESSING (SUMATERA & KALIMANTAN) • Marine Product Ind. • Essential Oil Ind. • Rubber Processing Ind. • Cocoa Processing Ind. • CPO Processing Ind. • Rubber Processing Ind. • CPO Processing Ind. • 2. Rubber Processing Ind. • Marine Product Ind • Ship Ind. • Rubber Processing • Ind. • Cocoa Ind. • CPO Processing Ind. • 2. Coconut Processing • Ind. • Rattan Processing • Ind. • Marine Product Ind. • Metal Product Ind. • CPO Processing Ind. • Rubber Processing Ind. • Rubber Processing Ind. • 2. Marine Product Ind. • Corn Processing Ind. • 2. Starch & Pasta Processing Ind.
MAP OF DEVELOPMENT OF PROVINCE’S CORE PRODUCT PROCESSING (JAVA & EASTERN INDONESIA) • Cconut Processing Ind. • 2. Marine Product Ind. • Marine Product Ind. • Cocoa Processing Ind • Cocoa Processing Ind • 2. Marine Product Ind. • Coconut Processing Ind. • Textile & Textile • Product Ind. • 2. Wood Processing Ind. • Corn Processing Ind. • Marine Product Ind. • Wood Processing Ind. • Cocoa Processing Ind. 1. Marine Product Ind. • Cocoa Processing Ind. • ICT Ind. • Creative Ind. • ICT Ind • Art Product Ind. • Ship Ind. • Cocoa Processing Ind. • 2. Coffee Processing Ind. • Cocoa Processing Ind • 2. Corn Processing Ind. • Marine Product Ind. • Textile & Textile • Product Ind. • Leather & Footwear Ind. • 2. Wood Processing Ind.
SOME SPOTTED ISSUES PROBLEMS IN INDUSTRIAL SECTORS • Very high dependencies on imported materials, intermediate goods, and components; • Limited varieties and types of industries; • Low depth industrial structures; • Limited diversifications of export products; • Imbalance roles of SMIs in industrial structures; • Industries mostly spread out in Java (> 60 %). NATIONAL PROBLEMS • High unemployment and poverty; • Slowing down exports; • Relatively low economic growth (recently good economic growth, but considered ‘not in a good & strong quality’ yet); • Limited infrastructure; • Lagged technological capability and low human resource quality; • Smuggling, labor issues, high economy costs; • Less competitive bank interests.
1 INTRODUCTION 2 3 TOWARDS INTEGRATED INNOVATION SYSTEM 4 CONCLUDING REMARKS OUTLINE INDUSTRIAL CLUSTER DEVELOPMENT
MRT’s Strategic Plan ABPof MRT AB MRT Non-Min. Agency’s SP ABP of NMAs AB of NMAs Ministerial Agency’s SP ABP of MAs AB of MAs Regional Strategic Policy ABP of Regional R&Ds AB of Regional R&Ds Country Policy FRAMEWORK on STI Constitution UUD -1945 ActNo. 18/2002 National System on S&T White Papers 2005 - 2025 Act No. 17/2007 NLTDP 2005- 2025 S&T Vision 2005 - 2025 National Innovation System KIB II (Cabinet) Vision & Mission Food Security New and Renewable Energy S&T National Strategic Policy NMTDP 2010-2014 Transportation Information & Communication Defence & Security NRA 2010-2014 Health & Medicine Advanced Material Annual Govt. Avtivity & Budget Plan Annual Govt. Budget
Partial & Fragmented Policy Measures THE NEEDS FOR MORE INTEGRATED & COHERENT POLICY FRAMEWORK Renewed Policy Framework & Measures More Coherent & Synergetic Policy Framework & Measures General conditions STI Supply Shared focus Linkages & services STI Demand Creative-innovative culture International dimensions Better Ecosystems for Innovation
Permintaan (Demand) Konsumen (permintaan akhir) Produsen (permintaan antara) Sistem Politik Sistem Industri Sistem Pendidikan dan Litbangyasa Pemerintahan Perusahaan Besar Pendidikan dan Pelatihan Profesi Intermediaries Lembaga Litbangyasa Brokers Penadbiran (Governance) Pendidikan Tinggi dan Litbang UKM “Matang/ Mapan” Litbang Pemerintah PPBT Kebijakan RPT Supra- dan Infrastruktur Khusus Standar dan Norma Dukungan Inovasi dan Bisnis HKI dan Informasi Perbankan Modal Ventura Framework Conditions Kondisi Umum dan Lingkungan Kebijakan pada Tataran Internasional, Pemerintah Nasional, Pemerintah Provinsi, dan Pemerintah Kabupaten/Kota • Kebijakan Ekonomi • Kebijakan ekonomi makro • Kebijakan moneter • Kebijakan fiskal • Kebijakan pajak • Kebijakan perdagangan • Kebijakan persaingan • Budaya • Sikap dan nilai • Keterbukaan terhadap pembelajaran dan perubahan • Kecenderungan terhadap Inovasi dan kewirausahaan • Mobilitas dan interaksi Kebijakan Keuangan Kebijakan Pendidikan Kebijakan Promosi & Investasi Infrastruktur Umum/ Dasar Kebijakan Industri/ Sektoral SDA dan Lingkungan STRATEGIC POLICY AGENDA TO STRENGTHEN THE INNOVATION SYSTEM Institutions, S&T Supports & Absorptive Capacity of Industry Interactions & Services Focus & Synchronized Value Chains Policy Issues 2 3 5 Global Policy Issues General Framework/ Conditions Innovation Culture ‘Alignment/Adaptation’ to Global Challenges 1 4 6
FRAMEWORK OF POLICY ON STI (BPPT) 1 Innovation Policy Framework : The Hexagon Strategic Initiatives: • Strengthening Regional Innovation System (RIS) : as a vehicle to strengthen pillars for fostering creativity-innovation at regional levels (as an integral part of the National Innovation System). • Industrial Cluster Development : as a vehicle to develop the best collective potentials and to enhance industrial competitiveness. • Innovation Network Development : as a vehicle to develop linkages and partnerships among actors, and dynamizing the flow of knowledge, innovation, diffusion, and learning. • Technopreneurship Development : as a vehicle to modernize business/economy & society, and to develop innovation culture. • Strengthening Thematic Pillars : as a vehicle to improve the thematic and contextual elements of the innovation system. 6 2 • National R&T Coord. Meeting 2008 • Strategic Plan of MRT 2010-2014 5 3 4 • Develop conducive general framework/conditions for inovation and business. • Strengthen knowledge institutions and S&T supports, and enhance absorptive capacity of industry (esp. SMEs). • Develop synergetic collaboration for innovation and its diffusion, and increase knowledge-/ technology-based services. • Foster innovation culture. • Develop and strengthenintegrated efforts of innovation system and industrial cluster development (at the national and regional levels). • Develop and adapt strategic responses to global changes and challenges. Academic Draft of the White Paper on the National Innovation System
STRATEGI : ‘FLAGSHIP’ PROGRAM (SUB PROGRAM) Pro Poor ... Pro Job ... Pro Growth ... Pro Environment ... Pro Innovation ...
INNOVATION POLICY FRAMEWORKAND STRATEGIC INITIATIVES Vision & Missions of the National & Regional Sustainable Development StrategicInitiatives Techno- preneurship Thematic Pilars Innovation Network Industrial Cluster RIS Innovation Policy Framework Flagship Programs Academic Draft of the White Paper on the National Innovation System
1 INTRODUCTION 2 3 TOWARDS INTEGRATED INNOVATION SYSTEM 4 CONCLUDING REMARKS OUTLINE INDUSTRIAL CLUSTER DEVELOPMENT
CONCLUSION • Indonesia as a large country is moving forward, but needs to move faster & in a much better pattern; • ‘Fragmented/incoherent’ policy framework & effective measures are among challenging issues; • Significant improvements in STI policy & industrial renewal are required; • Strong commitment & consistency to invest in innovation may be among the most leveraging factors; • Better collaboration/partnership within the country and internationally is a must.
Recommendation for enhancement of countrySTI policy • A clear & formal comprehensive innovation policy framework to address the most essential systemic failures and to lead STI advancement and utilization to contribute to high economic growth, inclusiveness, and green/sustainable development. • Industrial cluster development as a ‘development pillar’ in strengthening the innovation system (of “5 pillar programs or umbrella programs” need to be mainstreamed in the national & regional development agenda). • Better coordination & collaboration among key stakeholders. • Strong commitment to support innovation in • industries important to enhancing competitive advantages, • regional & the youth creativity-innovation development. • STI human resource development. • Significant improvements in budgeting system: • Improvements in government budget mechanisms & supports • Better funding supports for STI advancement & utilization (including effective incentive schemes).
... in harmony we progress ... Thank You Gerakan Membangun Sistem Inovasi, Daya Saing dan Kohesi Sosial di seluruh Wilayah Nusantara (National movement to develop innovation system, competitiveness, and social cohesion through out the Country) Dr. Tatang A. Taufik Deputy Chairman Agency for the Assessment and Application of Technology BadanPengkajiandanPenerapanTeknologi (BPPT) GedungII BPPT, Lt 13 Jl. MH. Thamrin 8, Jakarta 10340 - INDONESIA Telp. (021)-316 9441 / 9442 Fax. (021)-319 24127 E-mail: tatang.taufik@bppt.go.id
Demographic Factors Of the 240 million people in Indonesia, over 60% of the population is under 39 years old, providing a dynamic workforce. 2010 2030 (Est) 2050 (Est) Age 100+ China 1,3 Bi India 1,2 Bi US 310 Mn Indonesia 242 Mn Brazil Age 0 30
NATURAL RESOURCE-BASED PRODUCTIONS World largest producer no 5: Nuts 69.4 M ton World largest producer no 4: Coffee 465,000 ton World largest producer no 10: Fruits 11.6 M ton World largest producer no 3: Rice 35.8 M ton World largest producer no 6: Agricultural US$ 60 billion World largest producer no 6: Tea 150,000 ton World largest producer no 3: Cocoa 545,000 ton World largest producer no 3: Rubber 2.80 M ton World largest producer no 1: CPO 465,000 ton World largest producer no 6: Copper 789,000 ton World largest producer no 2: Tin 102,000 ton World largest producer no 4: Bauxite Cad . no 7 World largest producer no 3: Nickel 229,000 ton World largest producer no 7:Gold 105,000 ton World largest producer no 10: Natural Gas 69.7 Bil. cubic mtr. World largest producer no 6: Coal 141.1 M ton oil eq World largest producer Geothermal 40% of the world’s resources Source : Indonesia Engineer Association, 2011
NATIONAL DEVELOPMENT CHALLENGES Regional Shares on the National Economy Regional disparity needs strategic initiatives in strengthening the national innovation system (as an integral part of the national development)
PROVINCIAL TFP GROWTHS (AVERAGE 2001-2008)IN THE 6 ECONOMIC CORRIDORS TFP : Total Factor Productivity Source : BPPT, 2011
BRAIN DRAIN PHENOMENA • Emigration of highly qualified STI human resources (highly educated, experts, scientists, etc.) of a country • Migration /urbanization of talented people, usually from rural (unattractive regions) to urban areas (more attractive regions/places) • Profession/occupation switching (from previous developed competency to different career paths) • Massive exodus from an R&D organization to other or different organizations.
CHALLENGES IN POLICY IMPLEMENTATION • Political related issues • Leadership – short-sighted vision/interests • Capability - Human resource related issues (incl. regional brain drain phenomenon) • Bureaucratic system • Very limited budget supports • Limited basic infrastructures • Limited involvement of local universities/HEs & business communities
FUNDING FOR RD&I :GROSS EXPENDITURE ON R&D (GERD) National GERD and GERD/GDP Ratio, 2009 Note: 1) Based on R&D Survey in University Sector, 2010 2) Based on R&D Survey in Industry Sector, 2010 3) Based on R&D Survey in Government Sector, 2008* * the estimates with an average growth rate Goverment R&D budget since 2005-2008. Shows the breakdowon of R&D expenditure by sector in 2009. Government and Higher Education shares to the R&D expenditure were higher (with ratio of GERD 0,04% for Government and 0,03% for Higher Education) compared to that of Manufacturing industry (0.02%). Source: LIPI (Dec, 2011) based on R&D survey in University sector (2009), Industry sector (2010), and Government sector (2006)
GERD INDONESIA A breakdown of R&D investment in Africa, Asia and the Pacific. GERD by sector of performance, 2007 or latest available year Source: UIS, August 2010 Note: +1 = 2008, -1 = 2006, -2 = 2005, -3 = 2004, -5 = 2002. www.uis.unesco.org