Download
1 / 22
220 likes | 398 Vues
Describing Relationships Using Correlations. More Statistical Notation. Correlational analysis requires scores from two variables. X stands for the scores on one variable. Y stands for the scores on the other variable. Usually, each pair of XY scores is from the same participant.

E N D
More Statistical Notation Correlational analysis requires scores from two variables. X stands for the scores on one variable. Y stands for the scores on the other variable. Usually, each pair of XY scores is from the same participant.
More Statistical Notation • As before, indicates the sum of the X scores, indicates the sum of the squared X scores, and indicates the square of the sum of the X scores • Similarly, indicates the sum of the Y scores, indicates the sum of the squared Y scores, and indicates the square of the sum of the Y scores
More Statistical Notation Now, indicates the the sum of the X scores times the sum of the Y scores and indicates that you are to multiply each X score times its associated Y score and then sum the products.
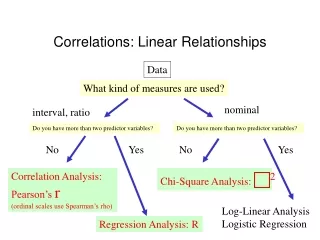
Correlation Coefficient • A correlation coefficient is the statistic that in a single number quantifies the pattern in a relationship • It does so by simultaneously examining all pairs of X and Y scores
Drawing Conclusions • The term correlation is synonymous with relationship • However, the fact that there is a relationship between two variables does not mean that changes in one variable cause the changes in the other variable
Plotting Correlational Data • A scatterplot is a graph that shows the location of each data point formed by a air of X-Y scores • When a relationship exists, a particular value of Y tends to be paired with one value of X and a different value of Y tends to be paired with a different value of X
A Scatterplot Showing the Existence of a Relationship Between the Two Variables
Scatterplots Showing No Relationship Between the Two Variables
Linear Relationships • A linear relationship forms a pattern that fits a straight line • In a positive linear relationship, as the scores on the X variable increase, the scores on the Y variable also tend to increase • In a negative linear relationship, as the scores on the X variable increase, the scores on the Y variable tend to decrease
Nonlinear Relationships In a nonlinear, or curvilinear, relationship, as the X scores change, the Y scores do not tend to only increase or only decrease: at some point, the Y scores change their direction of change.
Strength • The strength of a relationship is the extent to which one value of Y is consistently paired with one and only one value of X • The larger the absolute value of the correlation coefficient, the stronger the relationship • The sign of the correlation coefficient indicates the direction of a linear relationship
Correlation Coefficients • Correlation coefficients may range between -1 and +1. The closer to 1 (-1 or +1) the coefficient is, the stronger the relationship; the closer to 0 the coefficient is, the weaker the relationship. • As the variability in the Y scores at each X becomes larger, the relationship becomes weaker
Pearson Correlation Coefficient • r used to describe a linear relationship between two scale variables
Spearman Rank-Order Correlation Coefficient • describes the linear relationship between two variables measured using ranked scores. The formula is where N is the number of pairs of ranks and D is the difference between the two ranks in each pair.