Download
1 / 24
250 likes | 376 Vues
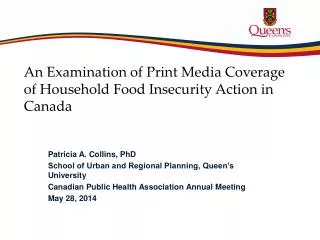
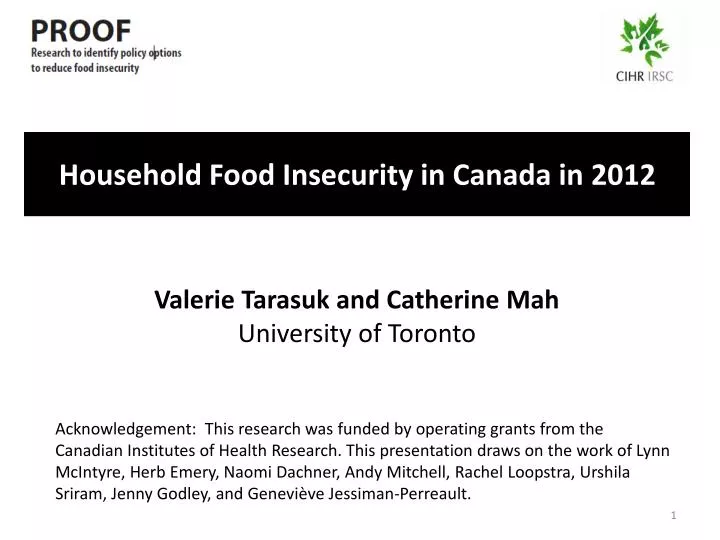
Household Food Insecurity in Canada in 2012. Valerie Tarasuk and Catherine Mah University of Toronto.

E N D
Household Food Insecurity in Canada in 2012 Valerie Tarasuk and Catherine Mah University of Toronto Acknowledgement: This research was funded by operating grants from the Canadian Institutes of Health Research. This presentation draws on the work of Lynn McIntyre, Herb Emery, Naomi Dachner, Andy Mitchell, Rachel Loopstra, UrshilaSriram, Jenny Godley, and GenevièveJessiman-Perreault.
FINANCIAL INSECURITY and INSUFFICIENCY Food insecurity: uncertain and insufficient access to food arising from resource constraint Hunger Adverse socioemotional effects Social exclusion Reduced food intake Stress, worry & anxiety Reduced quality of food intake Potential Manifestations: Severity and Duration Poor nutritional status Chronic health conditions Obesity Poor child development and learning Compromised mental health Potential Health Outcomes:
Household Food Security Survey Module(administered on the Canadian Community Health Survey since 2004) Worry about not having enough food Reliance on low-cost foods Not being able to afford balanced meals Adults/children skip meals Adults/children cut size of meals Adults/children not having enough to eat Adults/children not eating for whole day 18 questions, differentiating adults’ and children’s experiences over last 12 months: “because there wasn’t enough money to buy food?”
Household Food Insecurity in Canada in 2012 Worry about running out of food and/or limit food selection because of lack of money for food. Compromise in quality and/or quantity of food due to a lack of money for food. Miss meals, reduce food intake and at the most extreme go day(s) without food. Data Source: Statistics Canada, Canadian Community Health Survey (CCHS), 2007, 2008, 2011 and 2012.
Household Food Insecurity in Canada in 2012 • 12.6% of households reported some food insecurity. • 4 million Canadians lived in food-insecure households in 2012. • 1 in 6 children under the age of 18 (i.e., 1.15 million children) lived in food-insecure households. Relationship to food bank statistics? 882,188 individuals received assistance from food banks in March 2012 (Food Banks Canada, HungerCount 2012).
12.6% 13.4% 16.2% 17.5% 15.6% 13.5% 11.7% 12.1% 12.5% 11.5% 12.7% 17.1% 20.4% 45.2% Data Source: Statistics Canada, Canadian Community Health Survey (CCHS), 2012.
Prevalence of household food insecurity in major census metropolitan areas, 2011-2012 Data Source: Weighted estimates from CCHS 2011-12
Prevalence of household food insecurity by income, 2011
In addition to income, other factors associated with heightened vulnerability to food insecurity include: Not owning one’s home Being aboriginal or black Being a recent immigrant Living in urban Canada Being in a lone-parent, female-led household Relying on social assistance
Data Source: CCHS 2011-12 Note: PEI and Northwest Territories have been omitted because of the small size of the samples there.
Why are social assistance recipients so vulnerable? • Incomes fall below basic living costs in most jurisdictions. • Most provinces do not index benefits to inflation. • Limits on allowable assets mean recipients have typically have no savings and therefore no capacity to buffer sudden increases in expenses or interruptions in income.
15.7% 10.6% • Drop in food insecurity between 2007 and 2011 reflects decreased vulnerability of social assistance recipients with province’s Poverty Reduction Strategy launched in 2006. • Among the changes: • Social assistance benefits were increased and indexed benefits to inflation. • Asset limits and earnings exemptions were raised. (R Loopstra, unpublished analysis.)
Most food insecure households are reliant on employment incomes. % food insecure Data Source: CCHS 2011-12
Why are so many households reliant on employment incomes food insecure? low-waged jobs short-term, part-time employment single (vs dual) earner households inadequacy of income transfers provided to supplement low employment incomes
The low rate of food insecurity among Canadian seniors reflects the effect of policy interventions targeting income. • In 2012, 7% of households reliant on seniors’ incomes were food insecure. • versus 11% among those reliant on employment and 70% among those on social assistance. • Seniors have guaranteed annual incomes, indexed to inflation, and drug coverage, transit subsidies, ‘seniors days’ discounts. • Turning 65 drops the risk of food insecurity in half for low-income adults. (Emery, Fleisch and McIntyre. How a Guaranteed Annual Income Could Put Food Banks out of Business, University of Calgary SPP Research Papers, Dec 2013)
Reducing food insecurity means intervening upstream, to tackle the severe financial constraints that give rise to this problem. FINANCIAL INSECURITY and INSUFFICIENCY Food insecurity: uncertain and insufficient access to food arising from resource constraint Hunger Adverse socioemotional effects Social exclusion Reduced food intake Stress, worry & anxiety Reduced quality of food intake Potential Manifestations: Severity and Duration Poor nutritional status Chronic health conditions Obesity Poor child development and learning Compromised mental health Potential Health Outcomes:
Food insecurity policy actors: social network analysis Part of policy framing analysis, team led by McIntyre and Mah; purpose: to examine the makeup of the policy community for this issue • Nominate 3 ‘policy entrepreneurs’ • Three sets of qualities • Voice or claim to be heard • Connections or able to forge strategic relationships • Tenacity – persistence • Explain reasons for nominations • Identify areas of policy influence • State relationship with nominee 1 Consultation with research team, network, and partners to assemble roster 93policy actor roster members 2 3 Survey Social network analysis 70 roster members completed the survey, naming 117 unique nominees, of which 35 were roster members ‘Ego-centred’ network of 160 individuals, of which 11 were most frequently nominated = policy ‘entrepreneurs’
93 roster members 160 individuals in the network 11 entrepreneurs
Figure 1: Food insecurity policy network representation (n=160) Triangles = nonrespondent nominees Large circles = policy entrepreneurs Circles = respondents (roster members) Main ‘network’ component • Findings: • Most common policy role across network: academic (26.5%) and NGO (26.5%) • Few decision makers in government
Figure 2: Food insecurity policy network representation(colour-coded by region, n=160) BC – Green AB – Red SK – Grey MB – Yellow ON – Blue QC – Brown NS – Pink NL – Orange NU – Purple NWT – Teal • Findings: • Horizontal network • Predominance of Ontario, followed by BC • Regionally focused – nominations in own region
Figure 4: Food insecurity policy network representation(colour-coded by approach, n=160) Food-based – Red Mixed – Grey Income-based – Blue Analysis of network homophily (post-hoc) • Findings: • Like-minded individuals connect • ‘Mixed’ as bridge? • 11 entrepreneur nominations: approach not as important as perception of formal role, action, voice
Food insecurity policy actors: social network analysis Next step: interviews with entrepreneurs • Questions for discussion • What questions does this network analysis raise for you within the context of your own work? • How do these findings relate to your views on the key ingredients for policy change? How about policy change within jurisdiction of different orders of government (municipal-regional, provincial, federal)? • What is the role of ‘mixed’ approach actors? • Given the relative absence of governmental actors (consider legislative and executive), what are the implications for your own work?
Reducing food insecurity means intervening upstream, to tackle the severe financial constraints that give rise to this problem. FINANCIAL INSECURITY and INSUFFICIENCY Food insecurity: uncertain and insufficient access to food arising from resource constraint Hunger Adverse socioemotional effects Social exclusion Reduced food intake Stress, worry & anxiety Reduced quality of food intake Potential Manifestations: Severity and Duration Poor nutritional status Chronic health conditions Obesity Poor child development and learning Compromised mental health Potential Health Outcomes:
For emerging research, please subscribe to our website: http://nutritionalsciences.lamp.utoronto.ca Note:On our website, you can find links to the research papers and reports referred to in this presentation. If you have trouble accessing this material, please ‘Contact Us’ by following that link on the website.