Download
1 / 17
170 likes | 314 Vues
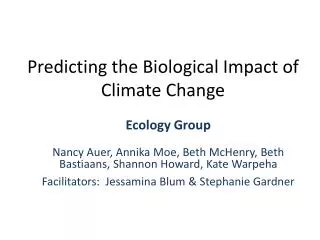
Predicting the Biological Impact of Climate Change. Ecology Group Nancy Auer, Annika Moe, Beth McHenry, B eth Bastiaans, Shannon Howard, Kate Warpeha Facilitators : Jessamina Blum & Stephanie Gardner. Context. 100 level non-majors intro biology course (lecture period is 50 minutes).

E N D
Predicting the Biological Impact of Climate Change Ecology Group Nancy Auer, Annika Moe, Beth McHenry, Beth Bastiaans, Shannon Howard, Kate Warpeha Facilitators: Jessamina Blum & Stephanie Gardner
Context • 100 level non-majors intro biology course (lecture period is 50 minutes). • Part of a unit near the end of the course. Students will already be familiar with graphing, the scientific method, and peer review. • This is the start of a one-week study of climate change. • This activity is especially effective in a discussion section, but can be adapted to use in a lecture.
Pre-class activity • Students read sections on the carbon cycle and greenhouse effect from their textbook. • Students take an online LRQ (Learning Readiness Quiz).
In-class activity • “A Song of Our Warming Planet” by Daniel Crawford. • One note = one year (1880 – 2012) • Each ascending half tone is roughly equal to 0.03oC Time 5 minutes
NASA graph: www.globalchange.gov Data from National Aeronautics and Space Administration: GISS Surface Temperature Analysis (GISTEMP)
In-class activityStep 1 Each student receives one of four graphs. Students at the same table receive the same graph. Graphs: CO2, temperature, ice cover, atmospheric oxygen
In-class activity: Step 2 (formative) As a group, students identify and describe the trend they see in one sentence. Each student writes it down on her/his graph. (Discussion in groups only – students do not report out.) Time: 5 minutes
In-class activityStep 3 Jigsaw: At the start of class each student received a number or color, etc. Students form new groups, and all graphs are represented in the new groups.
In-class activity: Step 4(formative) Share the one-sentence trend you discovered in your first group. SI time: 2 minutes Student time: 2 minutes
In-class activity: Step 5(formative) How might living organisms be affected by one or more of the observed trends? Brainstorm at least two hypotheses as a group. Example: Maple syrup production in Canada will increase as temperature increases. Challenge example – combine trends: An increase in CO2 in addition to temperature will further increase maple syrup production. Reminder: X-axes may not have the same time range. Reminder: Your hypothesis doesn’t necessarily have to be negative. SI time: 3 minutes Student time: 10 minutes
In-class activity: Step 6(formative) Consider your hypotheses. As a group, choose one that could be tested. On the board, write your hypothesis and a brief description of how you would test it. Include: Which variables would you measure? What existing data (satellite images, ice cores, .gov sites, etc.) could you use? SI time: 7 minutes Student time: 15 minutes
In-class activity: Step 7(formative) Group feedback: Rotate one position to the left. On the board, in a different color, provide written feedback only in the form of questions. SI time: 3 minutes Student time 8 minutes
In-class activity Step 8 • As a group, students review the feedback they received and discuss revisions to their research plan. • Each student takes notes on the revised research plan and keeps it for a homework assignment. Time: 8 minutes
Summative Assessment: Individual Homework 1. Using the research plan you composed in class, draw a graph of hypothetical data that: Would support your hypothesis. Would not support your hypothesis. 2. In no more than 200 words, summarize your hypothesis and revised research plan. 3. Submit your summary and both of your graphs.
Expanding this unit Explain or remind students of the limitations of experimental design for real scientists (money, travel, time, ethics, etc.) and ask students to consider this in their research plan. Ask students to find an article about climate change in the popular press. Students can discuss in class whether the findings or predictions in the article match the data in their graphs. Assign each student group a specific organism and ask them to predict the impact of climate change on that organism. After the exercise, the instructor can choose a few research plans (some especially good and/or some containing some flaws) to discuss in the following class period. Have students report out their hypotheses and have the class discuss and/or vote on their favorites. All students could build a research plan around the favorite hypothesis. Ask students (as individuals or groups) to find research or data that supports or refutes their hypothesis. Students are required to reference some resources they used to find (or not find) any data regarding their hypothesis. If data is found, the student should briefly summarize it in writing to submit to the instructor or share with the class. If no relevant data is found, the student should posit why the research plan they proposed has not yet been done. Ambitious students or majors students could be required to incorporate all four trends in their hypothesis.