Download
1 / 8
80 likes | 84 Vues
This presentation provides an overview of the different sources of revenue for Australian states and territories, focusing on state taxes, goods and services tax (GST), payroll tax, stamp duty, insurance tax, and land tax.

E N D
State revenue from taxes Taking a look in six slides June 2015
States and territories provide a range of essential services to Australians • The revenue to fund these services comes from:1 • Other 24% State tax 31% Other grants from Federal Government 22% Goods and services tax (GST) 23%
The GST only applies to some goods • A GST of 10 per cent is collected by businesses on the sale of many goods and services in Australia. The GST is the single largest source of Commonwealth funding for state governments. • …with many goods and services exempt from the GST. • Just under half of consumption is subject to the GST…
GST exemptions are not necessarily targeted at low income households Spending on GST exempt items as a share of income 3 • Lower-income households spend a greater proportion of their income on goods and services exempt from GST. GST revenue foregone due to exempt items3 • But higher-income households receive most of the benefits of these exemptions as they spend more (in dollars) on GST-exempt items.2
Payroll tax is a large source of tax revenue for state governments Payroll taxes 31% • Approximately one-third of state tax revenues or 10 per cent of state revenue around Australia is collected from payroll taxes1– however, there are different rates and bases for payroll tax between states. As such, businesses face a different set of rules for each state and territory. • Existing payroll taxes can also be complex. Businesses with payrolls below a set threshold amount are not required to pay payroll taxes. While this can reduce their tax burden, it can also impact on their decisions about expanding.
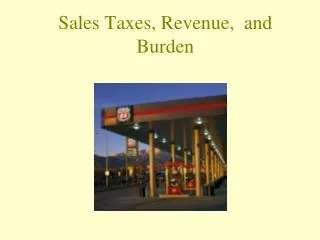
State and territories also raise revenue through transaction taxes Stamp duties and insurance taxes as a share of state tax revenue 2013-141 • Stamp duties on the transfer of property are a significant source of tax revenue, but can be volatile. • Stamp duties increase the cost of buying property and can affect decisions to move to a better suited home, or for businesses to move to a new location that may better suit their needs.4 • Insurance taxes increase the cost of insurance, so some people may underinsure as a result.5 Insurance tax 8% Stamp duty on property 23%
Land tax • People need land to live or conduct business. As land can’t be moved this means broad taxes on land do not affect decisions people and businesses make about their use of land, making it an efficient way to raise revenue. All states and territories except for the Northern Territory have land taxes on property, but there are a number of different rates and concessions for land taxes. Local governments also levy taxes on land in the form of municipal rates.
Notes • Sources: ABS, Taxation Revenue, Australia, 2013-14; Government Finance Statistics, Australia, 2013-14. • The main categories of GST‑exempt spending are fresh food, health, education, rent, and financial supplies. • The top chart shows GST‑exempt spending as a percentage of household disposable income. The bottom chart shows the GST revenue foregone for higher and lower income households as a share of total GST foregone revenue from all households. Lower (higher) income households are households in the bottom (top) income quintile based on gross household income.Source: Treasury estimates using ABS 2011, Household Expenditure Survey 2009‑10, cat. No. 6530.0 • Independent Economics 2014, Economic impacts of negative gearing of residential property — report for the Housing Industry Association, Independent Economics, Canberra; and NSW Treasury 2012, NSW Financial Audit 2011 (‘Lambert review’), NSW Treasury, Sydney. • Tooth, R and Barker, G 2007, The Non‑Insured: Who, Why and Trends — prepared for the Insurance Council of Australia.