Download
1 / 25
260 likes | 372 Vues
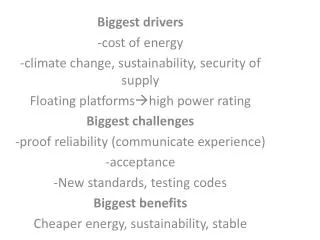
Drivers of Change. Demographic Aging + Minority Growth Economic Stagnating real incomes; higher unemployment Financial Tighter money for home loans Preference More amenities, more options, better accessibility. US Starter, Mature, Downsizing Trends. Source : ICF Consulting.

E N D
Drivers of Change • Demographic • Aging + Minority Growth • Economic • Stagnating real incomes; higher unemployment • Financial • Tighter money for home loans • Preference • More amenities, more options, better accessibility
US Starter, Mature, Downsizing Trends Source: ICF Consulting.
2002 actual through 2012 estimated R2=0.82; 9.7% annual Δ; 3+X faster than inflation; 2020 = $8+/gallon Source: Adapted fromEnergy Information Administration (2012).
California Homeowner Share 2000-2010 Source: Myers (2011) and Census
National and California Housing Demand by Type Source: Adapted from National Association of Realtors (2011).
NAR 2011 Survey Highlights Source: Adapted from National Association of Realtors (2011). (Questions paraphrased.)
Southern California Preferences Source: Fairbank, Maslin, Maullin, Metz and Associates (October 2011)
Southern California Preferences Source: Fairbank, Maslin, Maullin, Metz and Associates (October 2011)
Southern California Preferences Source: Fairbank, Maslin, Maullin, Metz and Associates (October 2011)
MPO Demand by Housing Type 2010 Source: Arthur C. Nelson.
A small lot (<5,000 sq.ft.) does not mean a small house
Residential Unit Preferences for Non-Hispanic White and Minority Households Source: Adapted by Arthur C. Nelson from Baldasarre (2001, 2002, 2004).
MPO Housing Demand by Type to 2035 Source: Arthur C. Nelson.
TSA Demand 2035, Big 4 MPOs Source: Arthur C. Nelson.
Transit Station Area Demand, Big 4 MPOs Source: Arthur C. Nelson.
Supply & Demand Comparison, US Source: Supply from NHTS 2009 (2011); demand from Porter-Novelli (2003, 2005)
Observed Walk/Bike Share Within 1-Mile, US Source: National Household Travel Survey 2009 (2011).
Life-Spans of Major Uses Source: Arthur C. Nelson.
Observations First,while there are always exceptions and market niches will be different, adding generally to the current inventory of conventional lots exacerbates the current excess supplyand erodes value of existing homes on those lots. Second,surveys indicate that even if all new residential development were absorbed in existing and planned TODs by 2035 half or more of the demand for living in TODs would still not be met. Third, there is sufficient developed land to absorb all new and recycled nonresidential development; this is because between 2010 and 2035 about half of all low-FAR structures will be redevelopedand/or repurposed. Fourth, merely meeting the market demand for more attached products and accessibility to transit could bring California’s major metropolitan areas into compliance with SB 375.