Download
1 / 12
120 likes | 223 Vues
Bridge Program Performance Measure Overview. ODOT/FHWA Stewardship Oversight Committee Meeting Gary Bowling (ODOT) and Tim Rogers (FHWA) May 29, 2012. Bridge Program Area. FHWA Lead – Tim Rogers ODOT Lead – Bruce Johnson “Bridge” Performance and Compliance Indicators address the following:

E N D
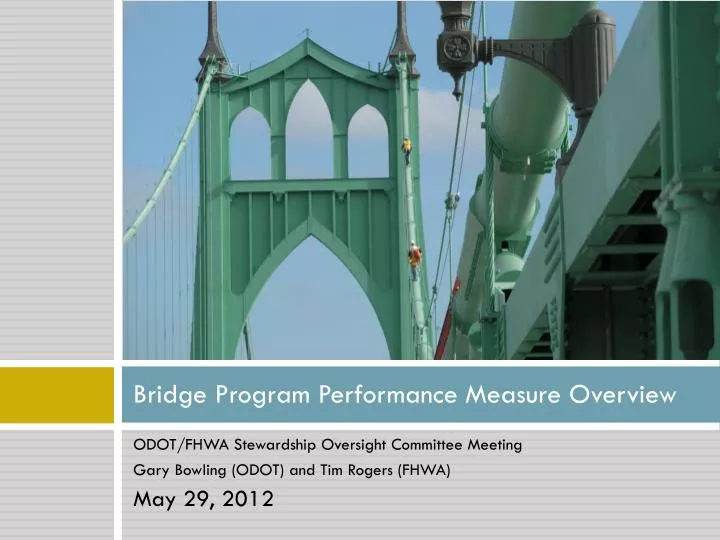
Bridge Program Performance Measure Overview ODOT/FHWA Stewardship Oversight Committee Meeting Gary Bowling (ODOT) and Tim Rogers (FHWA) May 29, 2012
Bridge Program Area • FHWA Lead – Tim Rogers • ODOT Lead – Bruce Johnson • “Bridge” Performance and Compliance Indicators address the following: • Performance Indicators1 &2: Bridge Condition • Compliance Indicators 3 thru 5: Bridge Inspection • Performance Indicators 6 & 7: Bridge Maintenance
Bridge Condition Performance Indicators • Percent of NHS bridges rated structurally and functionally deficient as measured by deck area • Percent of Non-NHS bridges rated structurally and functionally deficient as measured by deck area • Structurally Deficient = Structural Components are in “Poor” or worse condition or the “Structural Evaluation” or “Waterway Adequacy” is intolerable. • Functionally Deficient = Deck geometry, load carrying capacity, clearance, or approach roadway alignment no longer meets the criteria for the system.
Bridge Condition Performance Indicators • Percent of NHS Bridge Deck area rated structurally and functionally deficient
Bridge Condition Performance Indicators • Percent of Non-NHS Bridge Deck area rated structurally and functionally deficient
Bridge Inspection Program Compliance Indicators • Percent of routine bridge inspections completed within the established bridge inspection cycle • 24 month inspection cycle • Percent of fracture critical bridge inspections completed within the established bridge inspection cycle • 24 month inspection cycle • Percent of underwater bridge inspections completed within the established bridge inspection cycle • 60 month inspection cycle
Bridge Inspection Program Compliance Indicators • Percent of bridge inspections completed within the established bridge inspection cycle • Routine Inspections • Fracture Critical • Underwater
Bridge Maintenance Performance Indicators • Number of “urgent” maintenance recommendations not resolved after 12 months • Needs to be repaired ASAP to address a specific traffic safety concern. • Structural component rated in Poor Condition • Number of “critical” maintenance recommendations not resolved after 12 months • Needs to be repaired to prevent structure from being load posted. • Structural Component rated in Serious Condition
Bridge Maintenance Performance Indicators • Number of Urgentmaintenance recommendations not resolved after 12 months • Number of Critical maintenance recommendations not resolved after 12 months
Future Changes to Bridge Program Performance Indicators? • Bridge Inspection Program Compliance Indicators • Incorporate the results of the annual National Bridge Inspection Program (NBIP) compliance reviews: • % of NBIP Metrics in Satisfactory Performance Level • % of NBIP Metrics in Actively Improving Performance Level • % of NBIP Metrics in Unsatisfactory Performance Level • Delete the following: • Percent of routine bridge inspections completed within the established bridge inspection cycle • Percent of fracture critical bridge inspections completed within the established bridge inspection cycle • Percent of underwater bridge inspections completed within the established bridge inspection cycle
Future Changes to Bridge Program Performance Indicators? • Bridge Inspection Program Compliance Indicators
Bridge Program Performance Measure Overview • Questions?