Download
1 / 38
390 likes | 497 Vues
Goods Prices and Factor Prices: The Distributional Consequences of International Trade. Nothing is accomplished until someone sells something. ( popular business saying ). The Goals of this Chapter for ECN 665.

E N D
Goods Prices and Factor Prices: The Distributional Consequences of International Trade Nothing is accomplished until someone sells something. (popular business saying)
The Goals of this Chapter for ECN 665 • Use the general equilibrium model to understand how price changes lead to winners and losers. • Use different models to identify these winners and losers. • Introduce a two-country partial equilibrium model to see how shocks to supply and demand affect the terms of trade. • Use the partial equilibrium model to illustrate how consumers and producers are affected by international trade.
Who Wins and Who Loses? • Trade affects relative prices. • Changes in domestic relative prices influence factor rewards (e.g. wages) as well as the prices of goods we buy. • We can use different characterizations of the economy (i.e. models) to predict how real factor rewards respond to a price change.
Trade in a one-factor model • The Ricardian model assumes there is only one factor, labor. • Trade occurs because of differences in labor productivity. • Trade raises real GDP. Because everyone is alike, everyone gains. • Distribution is simple and unrealistic!
Trade based on factor proportions • Opening a country to trade (or reducing tariffs or quotas) raises the relative price of the exportable relative to the importable. • What happens to factor rewards depends on how this price change affects the demand and supply of each factor.
The Heckscher-Ohlin Model • Two industries: labor-intensive and capital-intensive • Two factors: labor and capital • Both factors are assumed to be in fixed supply and perfectly mobile across sectors. THIS MOBILITY ASSUMPTION IS VERY IMPORTANT.
The Heckscher-Ohlin Model (2) • Suppose freer trade raises the relative price of the labor-intensive good ( as it would in a labor-abundant country). • The higher price for the labor-intensive good leads this industry to expand and the capital-intensive industry to contract. • These production responses raise the wage and lower the rental on capital.
The Heckscher-Ohlin Model (3) • We summarize this analysis with the Stolper-Samuelson Theorem: an increase in the relative price of the labor (capital) intensive good raises the real return to labor (capital) and lowers the real return to the other factor. • Notice the REAL return is driven up or down.
What if factors are not mobile? • Then the demand for factors is linked only to the sector in which the factor works. • We summarize this insight in the specific factors model: specific factors gain in real terms when the price of the product they produce increases (and lose when it falls).
What if gains come because trade increases scale and/or variety? • We need to introduce increasing returns to scale and differentiated products. • It is possible for everyone to gain when trade is based on IRS industries. • There is a danger only in a small subset of cases: when countries are large enough to produce IRS goods but not large enough to do so on a big scale.
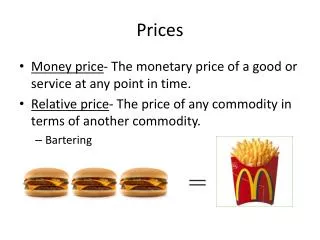
Measuring the Welfare Gains from Exchange:Producer Surplus and Consumer Surplus • Producer surplus: The net gains to producers of a product, equal to the total revenue minus the sum of marginal (variable) costs. • Consumer surplus: The net gains for consumers of a product, equal to the sum of all marginal gains minus the market price paid for the products.
Equilibrium price = $6 • Equilibrium quantity = 50
Equilibrium price = $613 • Equilibrium quantity = 50 • Producer surplus = $125 ($5x50 = $250/2 = $125)
Equilibrium price = $6 • Equilibrium quantity = 50 • Producer surplus = $125 ($5x50/2 = $250/2 = $125) • Consumer surplus = $75 (3x50/2 = $150/2 = $75)
Equilibrium price = $6 • Equilibrium quantity = 50 • Producer surplus = ($5x50)/2 = $250/2 = $125 • Consumer surplus = $75 ($3x50)/2 = $150/2 = $75 • Total gains from exchange equals consumer surplus plus producer surplus • Gains from exchange = ($8x50)/2 = $400/2 = $200
The Two-Country Partial equilibrium Model • The textbook emphasizes two-country models in order to remind you that what happens in one country affects markets in other countries. • Partial equilibrium models assume “all other things remain equal” in other markets, obviously an unrealistic assumption. • But, a two-country partial equilibrium model can isolate how, all other things equal, a change in a market in one country affects the market for the same product in another country. • Specifically, the two-country partial equilibrium model lets us estimate the changes in consumer and producer surplus in the two countries.
The Welfare Gains from Trade • Heartland producers gain surplus. • Heartland consumers lose surplus. • Orient producers lose surplus. • Orient consumers gain surplus. • But remember that we do not trade in one good – these changes are only for one market.
Applying the Two-Country Partial Equilibrium Model • Now that you understand the two-country partial equilibrium model and how to calculate the welfare gains from international exchange, you are ready to apply the model. • One interesting case is to examine the welfare effects of an increase in foreign demand for a product. • Specifically, suppose that in a certain market, demand increases in the foreign country that currently imports the good.
The Net Gains from Trade Increase in Both Countries after the Rise in Demand in Orient • An increase in foreign demand raises the price of corn in both countries. • Producers in Heartland gain welfare. • Consumers in Orient gain welfare. • The net gains from exchange increase in both countries.
Analyzing the Effect of Transport Costs on International Trade • The partial equilibrium model can be used to analyze how transport costs affect international trade. • Transport costs in effect drive a wedge in between the price received by an exporter and the price paid by a foreign importer. • Transport costs increase the cost of products to the final user, and it should not be surprising that they reduce both the volume of trade and the gains from trade. • The analysis of transport costs uses the concepts of consumer and producer surplus.
Consumer surplus is equal to the area A • Producer surplus is equal to the area B • The net gains from exchange are equal to the areas A + B
Transport costs of $40 raise the effective international supply curve from S to ST. • Transport costs drive a “wedge” between what suppliers receive and consumers pay. • The volume of trade falls from 40 to 20. • Producer surplus is reduced to area b. • Consumer surplus is reduced to area a.
Decreasing transport costs increase trade. • The international supply curve shifts down to ST2. • The equilibrium price falls to $60. • The gains from trade rise from a + b to a + b + c + d.
Trade and Transport Costs • An increase in transport costs reduces the gains from trade for both the importing and exporting countries. • A decline in transport costs increases the gains from trade. • Most of the increase in trade during the past two centuries is due to improvements in the efficiency of transportation.
The Effect of Trade on Price Competition • The partial equilibrium model is also useful for analyzing the gains from trade under imperfect competition. • International trade increases the number of potential suppliers, which tends to increase price competition. • Increased price competition reduces monopoly profit and deadweight losses. • The effect of increased competition can be visualized by comparing consumer and producer surplus under imperfect competition and under perfect competition.
Imperfectly competitive firms face a downward-sloping demand curve D. • Profit-maximizing firms equate marginal revenue equal marginal cost. • Prices exceed marginal cost. • The quantity supplied, q, is less than the quantity, Q, that would be supplied under perfect competition. • Total welfare is reduced by the “deadweight” loss, which is equals to area D.
When firms face the horizontal demand curve in a competitive global market, price declines from p to P. • Consumption shifts from c to C. • The competitive market eliminates the deadweight loss.