Download
1 / 1

E N D
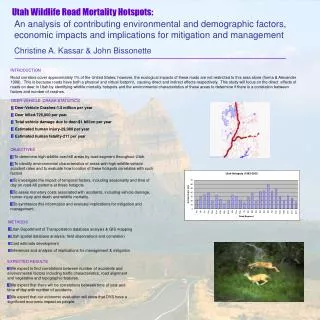
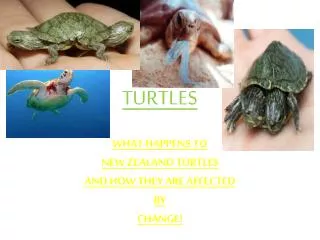
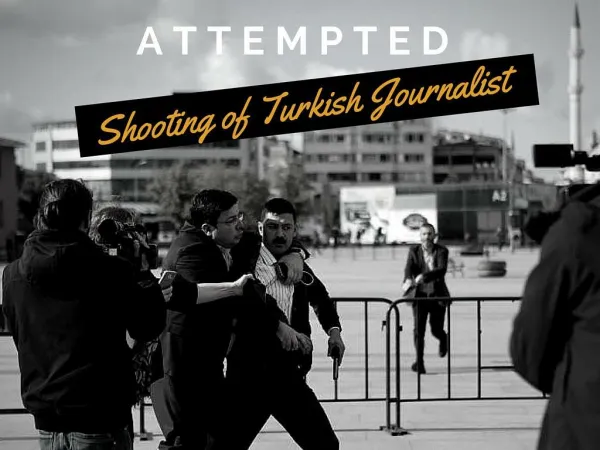
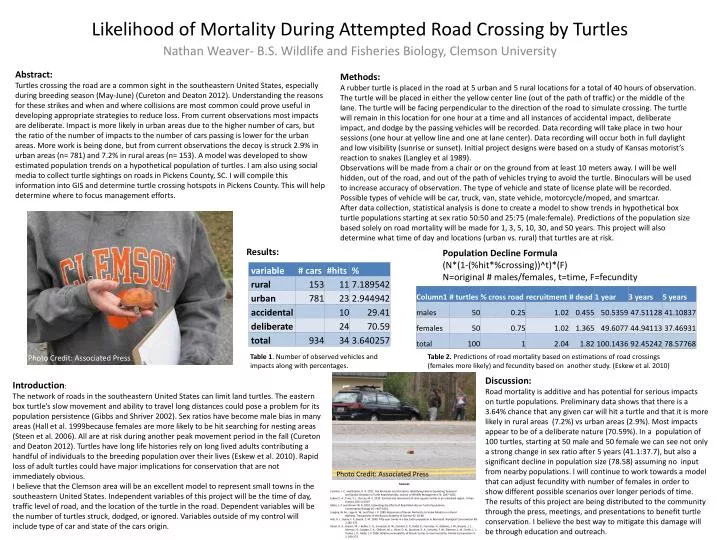
Abstract: Turtles crossing the road are a common sight in the southeastern United States, especially during breeding season (May-June) (Cureton and Deaton 2012). Understanding the reasons for these strikes and when and where collisions are most common could prove useful in developing appropriate strategies to reduce loss. From current observations most impacts are deliberate. Impact is more likely in urban areas due to the higher number of cars, but the ratio of the number of impacts to the number of cars passing is lower for the urban areas. More work is being done, but from current observations the decoy is struck 2.9% in urban areas (n= 781) and 7.2% in rural areas (n= 153). A model was developed to show estimated population trends on a hypothetical population of turtles. I am also using social media to collect turtle sightings on roads in Pickens County, SC. I will compile this information into GIS and determine turtle crossing hotspots in Pickens County. This will help determine where to focus management efforts. Methods: A rubber turtle is placed in the road at 5 urban and 5 rural locations for a total of 40 hours of observation. The turtle will be placed in either the yellow center line (out of the path of traffic) or the middle of the lane. The turtle will be facing perpendicular to the direction of the road to simulate crossing. The turtle will remain in this location for one hour at a time and all instances of accidental impact, deliberate impact, and dodge by the passing vehicles will be recorded. Data recording will take place in two hour sessions (one hour at yellow line and one at lane center). Data recording will occur both in full daylight and low visibility (sunrise or sunset). Initial project designs were based on a study of Kansas motorist’s reaction to snakes (Langley et al 1989). Observations will be made from a chair or on the ground from at least 10 meters away. I will be well hidden, out of the road, and out of the path of vehicles trying to avoid the turtle. Binoculars will be used to increase accuracy of observation. The type of vehicle and state of license plate will be recorded. Possible types of vehicle will be car, truck, van, state vehicle, motorcycle/moped, and smartcar. After data collection, statistical analysis is done to create a model to show trends in hypothetical box turtle populations starting at sex ratio 50:50 and 25:75 (male:female). Predictions of the population size based solely on road mortality will be made for 1, 3, 5, 10, 30, and 50 years. This project will also determine what time of day and locations (urban vs. rural) that turtles are at risk. Likelihood of Mortality During Attempted Road Crossing by Turtles Results: Population Decline Formula (N*(1-(%hit*%crossing))^t)*(F) N=original # males/females, t=time, F=fecundity Nathan Weaver- B.S. Wildlife and Fisheries Biology, Clemson University Table 1. Number of observed vehicles and impacts along with percentages. Table 2. Predictions of road mortality based on estimations of road crossings (females more likely) and fecundity based on another study. (Eskew et al. 2010) Photo Credit: Associated Press Discussion: Road mortality is additive and has potential for serious impacts on turtle populations. Preliminary data shows that there is a 3.64% chance that any given car will hit a turtle and that it is more likely in rural areas (7.2%) vs urban areas (2.9%). Most impacts appear to be of a deliberate nature (70.59%). In a population of 100 turtles, starting at 50 male and 50 female we can see not only a strong change in sex ratio after 5 years (41.1:37.7), but also a significant decline in population size (78.58) assuming no input from nearby populations. I will continue to work towards a model that can adjust fecundity with number of females in order to show different possible scenarios over longer periods of time. The results of this project are being distributed to the community through the press, meetings, and presentations to benefit turtle conservation. I believe the best way to mitigate this damage will be through education and outreach. Introduction: The network of roads in the southeastern United States can limit land turtles. The eastern box turtle’s slow movement and ability to travel long distances could pose a problem for its population persistence (Gibbs and Shriver 2002). Sex ratios have become male bias in many areas (Hall et al. 1999because females are more likely to be hit searching for nesting areas (Steen et al. 2006). All are at risk during another peak movement period in the fall (Cureton and Deaton 2012). Turtles have long life histories rely on long lived adults contributing a handful of individuals to the breeding population over their lives (Eskew et al. 2010). Rapid loss of adult turtles could have major implications for conservation that are not immediately obvious. I believe that the Clemson area will be an excellent model to represent small towns in the southeastern United States. Independent variables of this project will be the time of day, traffic level of road, and the location of the turtle in the road. Dependent variables will be the number of turtles struck, dodged, or ignored. Variables outside of my control will include type of car and state of the cars origin. Photo Credit: Associated Press Sources Cureton, J. C. and Deaton, D. R. 2012. Hot Moments and Hot Spots: Identifying Factors Explaining Temporal and Spatial Variation in Turtle Road Mortality. Journal of Wildlife Management 76: 1047-1052. Eskew, E. A., Price, S. J., Dorcas, M. E. 2010. Survival and recruiment of semi-aquatic turtles in an urbanized region. Urban Ecosyst. DOI 10.1007 Gibbs, J. P. and Shriver W. G. 2002. Estimating the Effects of Road Mortality on Turtle Populations. Conservation Biology 16: 1647-1652. Langley, W. M., Lipps H. W., and Theis J. F. 1989. Responses of Kansas Motorists to Snake Models on a Rural Highway. Transactions of the Kansas Academy of Science 92: 43-48. Hall, R. J., Henry, F. P., Bunck, C. M. 1999. Fifty-year trends in a box turtle population in Maryland. Biological Conservation 88: 2:165-172. Steen, D. A., Aresco, M. J. Beilke, S. G., Compton, B. W., Condon, E. P., Dodd, K., Forrester, H., Gibbons, J. W., Greene, J. L., Johnson, G., Langen, T. A., Oldham, M. J., Oxier, D. N., Saumure, R. A., Schueler, F. W., Sleeman, J. M., Smith, L. L., Tucker, J. K., Gibbs, J. P. 2006. Relative vulnerability of female turtles to road moratility. Animal Conservation 9: 3: 269-273.