Download
1 / 38
380 likes | 564 Vues
Data Mining the Yeast Genome Expression and Sequence Data. Alvis Brazma European Bioinformatics Institute. Why the yeast is interesting to the industry. Easy to work with (first) fully sequenced eukaryotic model organism 30% of genes have analogs in human

E N D
Data Mining the Yeast Genome Expression and Sequence Data Alvis Brazma European Bioinformatics Institute
Why the yeast is interesting to the industry • Easy to work with (first) fully sequenced eukaryotic model organism • 30% of genes have analogs in human • most known human disease genes have homologues in the yeast • for food industry interesting in itself
Genetic networks promoter1 gene1 promoter2 gene2 promoter3 gene3 promoter4 gene4 DNA transcription transcription factors RNA translation proteins
Mining the Yeast Expression Data • The long term goals: • reconstructing the gene regulation networks and relating it to metabolic pathways • Short term goals: • correlating gene expression profiles with gene functional classes and using this for prediction of gene functions • correlating gene expression profiles with promoter regions
Yeast gene expression during diauxic shift (DeRisi et al) Yeast cells from an exponentially growing yeast culture were inoculated into fresh medium and after some initial period were harvested at seven 2-hour intervals. Their mRNA were isolated, and fluorescently labeled cDNA prepared. Two different fluorescents were used - one from cells harvested in each of the successive time-points, other from the cells harvested at the first time-point (reference measurement). The cDNA from each time-point together with the reference cDNA were hybridized to the microarray with approximately 6400 DNA sequences representing ORFs of the yeast genome. Measurements of the relative fluerescence intensity for each element reflect the relative abundance of the corresponding mRNA.
Visualizing the data (expression profile of the “first” 250 genes)
Average expression level of genes at the respective time-points
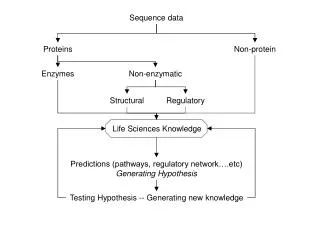
Three approaches • Finding correlations between gene expression profiles and their functional classes • Building decision trees for predicting gene functional classes from their expression data • In silico discovery of putative transcription factor binding sites in the regions upstream to the genes with similar expression profiles (to appear in Genome Research, Dec. 1998)
Energy gene subclasses in the yeast (less frequent merged in one)
Gene expression for energy genes during the diauxic shift at the seven time-points
Average expression levels at the 7 time-points and for energy class genes duringdiauxic shift
Average expression levels at all time-points and for all energy classes
Time points 1 2 3 4 5 6 7 Clustering the gene expression profiles by discretization of gene expression measurment space Logarithm of expression ratio 2 1 0 -1 Corresponding discrete pattern: 000012-1 Put the genes mapping to the same discrete pattern in a cluster -2
Organizationof a typical yeast promoter RNA URS URS TATA I 40 - 120 bp 20 - 700 bp Coding Region 40 - 60 bp
In silico discovery of transcription factor binding sites from expression data Take data from gene expression level measurements (from DNA array technologies) -> Cluster together genes with similar expression profiles -> Take sequences upstream from the genes in each cluster -> Look for sequence patterns overrepresented in a cluster
Clustering genes by similar expression profiles • Put in each cluster all genes that map to the same discrete pattern • Different thresholds give different clustering systems • We obtained 32 different clusters containing from 10 to 77 genes and 11 clusters containing at least 25 genes
Hypothesis to test Genes with similar expression profiles may be regulated by similar expression mechanisms and thus may contain similar transcription factor binding sites
Discovering regulatory elements in gene upstream sequences • Take the sequences of a certain length (e.g., 300 bp) upstream to all genes with a certain expression profile • Look for a priori unknown sequence patterns that are over-represented in these regions (taking into account the other upstream regions as background)
Pattern discovery in bioseqeucnes • Group together sequences thought to have common biological (structural, functional) properties, ignoring the purely sequence (syntactic) properties • Study the purely syntactic properties of these sequences ignoring their biological (semantic) properties.
Problem of “noise” • Gene expression measurement accuracy is bout factor of 2 (in 95% cases) • Clusters very dependant on the clustering method or thresholds • The same expression profile does not necessarily mean the same regulation mechanism
Dealing with noise • One cannot look for patterns common to the set of strings, but for patterns overrepresented in the set • looking for sets of patterns covering the set • Use of “negative” or background setquences
More powerful algorithms than the currently existing are needed • We used such new, more powerful algorithm, based on suffix-tree representation of the sequence space (implemented by Jaak Vilo at Helsinki University) • We looked systematically for all patterns discriminating the upstream regions in the clusters from randomly selected upstream regions
Use of negative sequences Looking for patterns that are overrepresented in the sequences upstream from genes in a cluster in comparison to all other upstream sequences
The rating function • Given two sets S+ and S- and a pattern P, return rating R(S+, S-,P) • Two rating functions that we used: • ratio: nr of sequences in S+ matching P divided by nr of sequences in S-matching P • probability that the pattern can occur in S+ “by chance” assuming that the occurrences in S- are “by chance” and using binomial distribution
The sequence pattern discovery experiment • We run the algorithm on upstream sequences (length 2 * 300) of all the 32 gene clusters • Each cluster produced hundreds of overrepresented patterns • The problem of validation
Some discovered sequence patterns from clusters of upstream sequences • Clusters with the increase in the expression level after time-point 6: CCCCT - known to be a stress responsive motif • Clusters with the decrease in the expression level after time-point 6: ATCC..T..A - RAP1 protein ATC..TAC - RAP1, REB1, BAF1 ATTTCA…T - GA-BF protein
Statistical validation of the discovered patterns • For each cluster choose a random set of upstream regions of the same number • Run the pattern discovery algorithm on the random regions set in addition to the cluster • Compare the scores of the discovered patterns from the cluster and random set
Conclusions • The discovered patterns are in accordance with the existing knowledge • Transcription factor binding sites can be discovered in silico from gene expression data • More refined and validated gene expression measurements are needed
Acknowledgements • Inge Jonassen (Bergen) • Jaak Vilo , Esko Ukkonen (Helsinki) • Alistair Ewing, Neil Skilling (Quadstone Ltd - developers of Decisionhouse data mining software) • BIOVIS and BIOSTANDARDS projects from the EU at EBI