Download
1 / 31
310 likes | 317 Vues
The Relation Between Academic Performance and Self-Esteem Depends…. Stephen C. Peck, Jacquelynne S. Eccles, & Oksana Malanchuk University of Michigan. Acknowledgements.

E N D
The Relation Between Academic Performance and Self-Esteem Depends… Stephen C. Peck, Jacquelynne S. Eccles, & Oksana Malanchuk University of Michigan
Acknowledgements This research is supported in part by NICHD Grant #R01 HD33437 awarded to Jacquelynne S. Eccles and Arnold J. Sameroff and in part by a grant from W. T. Grant awarded to Jacquelynne S. Eccles. The original data collection was supported by funding from the MacArthur Research Network on Successful Adolescent Development in High Risk Settings, chaired by Richard Jessor. We gratefully acknolwedge the contributions of the following people to this project (listed alphabetically): Elaine Belansky, Celina Chatman, Diane Early, Kari Fraser, Katie Jodl, Ariel Kalil, Linda Kuhn, Karen Macarthy, Rob Roeser, Arnold Sameroff, Sherri Steele, Cynthia Winston, and Carol Wong.
Academic Achievement – Esteem relation Hansford & Hattie (1982): r = .22 Hoge, Smit, & Crist (1995): r = .23 Valentine & DuBois (2003): B = .07 Background
MADICS: Maryland Adolescent Development in Context Study < $15,00 $15-$30,000 $30-$50,000 $50-$70,000 White Black Below Poverty Family Income in PG County Blacks Whites > $70,000 80 70 P 60 e r 50 c 40 e 30 n 20 t 10 0 U.S. PGC Marlyland Sample Prince George's County
Esteem Study Sample Total Sample Size: 777 families Race: Gender: 50 % Males 50 % Females 66 % Black 34% White Age of target youth (at Wave 1): Mean=12.7 years, range 11 to 16 Family Structure: Intact: 60% Step: 14% Live in: 4% Single-sep/div 16% Single-never married 6%
Study Sample (cont.) Family Income: Mean: $52,987 St. dev: $25,407 Range: $3,500 to > $150,000 Highest Level of Education High school degree or below: 30% Some college: 29% College degree: 22% Advanced degree: 18% Highest Occupational Level: Unemployed 2% Semi-skilled 20% Skilled 40% White collar professional 34% Advanced professional 4%
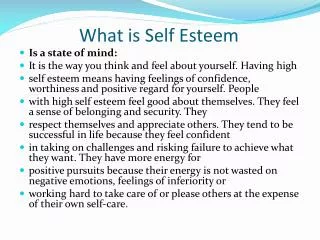
How often do you wish you were different than you are? How often would you like to change lots of things about you if you could? How often are you pretty sure about yourself? How happy are you with your life now? How happy are you with the kind of person you are? Self-Esteem Scale Cronbach’s Alpha: Wave 1 (.72) & Wave 3 (.80)
Grade Point Average (School Records) Final English Grade Final Science Grade Final Math Grade Final Health Grade Academic Performance Cronbach’s Alpha: Wave 1 (.88) & Wave 2 (.88)
Full Sample GPA-Esteem Structural Equation Model Estimates Standardized SEM Path Coefficients
Standardized SEM Path Coefficients (Bivariate Correlations in parantheses) Males (n = 388) Females (n = 389)
Blacks (n = 508) Whites (n = 269)
Black Males (n = 261) Black Females (n = 247)
White Males (n = 127) White Females (n = 142)
Youth Importance of Academic Skills e.g., Compared to other kids your age, how important [is Math] to you? 1=much less important to me than to other kids 7=much more important to me than to other kids Alpha’s = .74 (Wave 1) & .81 (Wave 3) “High Importance” = 6 or higher at both waves “Low Importance” = 4 or lower at both waves Levels of Academic Importance
Levels of Academic Importance High Low (n = 224) (n = 136) Med (n = 387)
Patterns of Importance Across Domains Compared to other things you do, how important are each of the following activities to you? Much Less Much More Important To Important To Me Me Than Other Than Other Things Things 1 2 3 4 5 6 7 Math or other school subjects? Sports? Playing a musical instrument or doing some other…art? Being good looking?
GPA & Esteemfor Academic v. Social Value Patterns Aca Only Aca+All (n = 182) (n = 223) Appearance (n = 93)
Perhaps there is something about our sample? not likely; our results are similar to others’… Perhaps we have not identified the right subgroup? possibly; we did find variation across subgroups Perhaps it’s a Brunswik symmetry issue? likely; global esteem and GPA exist at different levels Why is there no strong reciprocal relation between GPA and Esteem?
Full Sample relations between GPA and Academic Ability Self-Concept
Black Males (n = 257) Black Females (n = 243)
White Males (n = 124) White Females (n = 142)
Effect of Domain-Specific Self-Concepts on Global Self-Esteem (at 7th Grade) Predictors Standardized Beta Coefficients
Effect of Domain-Specific Self-Concepts on Global Self-Esteem (by Race x Sex) Predictors Standardized Beta Coefficients
Effect of Domain-Specific Self-Concepts on Global Self-Esteem Varies by Value Groups Value Group Self-Concepts Standardized Beta Coefficients
Effect of Domain-Specific Self-Concepts on Global Self-Esteem for the Academic Value Group (by Race x Sex) Predictors Standardized Beta Coefficients
Effect of Domain-Specific Self-Concepts on Global Self-Esteem after 8th Grade Predictors Standardized Beta Coefficients
Effect of Domain-Specific Self-Concepts on Global Self-Esteem at 7th & 8th Grade Predictors Standardized Beta Coefficients
The relation between GPA & Esteem depends…on… the population (or subpopulation) of interest The relation is generally small at the sample level The relation can be modest for specific subgroups the context in which the relation is examined Esteem depends largely on things other than GPA, like relationships with family and peers the time of measurement The GPA - Esteem relation changes over time Conclusions
Thank You(the end) Please see the following web page for more info: http://www.rcgd.isr.umich.edu/garp/