Download
1 / 50
510 likes | 703 Vues
Phylogenies & The Tree of Life. Learning Objectives. Describe the types of data that provide evidence for evolution. Explain how morphological, biochemical, and geological data provide evidence that organisms have changed over time.

E N D
Learning Objectives • Describe the types of data that provide evidence for evolution. • Explain how morphological, biochemical, and geological data provide evidence that organisms have changed over time. • Describe the types of evidence that can be used to infer an evolutionary relationship. • Explain how a phylogenetic tree and/or cladogram can be used to infer evolutionary relatedness.
Lizard or snake? • Eastern glass snake (Ophisaurusventralis) • Why isn’t this glass lizard considered a snake?
Comparison of Physical Characteristics Despite their superficial resemblance, the glass lizard id NOT a snake Glass Lizard Snakes
Phylogeny is a diagram of the evolutionary history of a species or group of related species • For example, this phylogeny shows that legless lizards and snakes evolved from different lineages of legged lizards • Legless condition evolved independently
Phylogenies show evolutionary relationships reflected in how they are grouped & named • What is the name of these two cats?
Phylogenies show evolutionary relationships reflected in how they are grouped & named • Taxonomy is the scientific discipline concerned with classifying and naming organisms • Developed byCarolus Linnaeus in the 18thcentury • Based on shared characteristics
Phylogenies show evolutionary relationships reflected in how they are grouped & named • Hierarchal scheme, the largest most inclusive grouping is the kingdom level • The most specific grouping is the species level • Each taxonomic unit is called a taxon • Mnemonic: King Philip Came Over For Good Soup
Phylogenies show evolutionary relationships reflected in how they are grouped & named • A species scientific name is Latin and composed of the Genus name followed by species name • The panther’s scientific name is Panthera pardus • The cheetah’s scientific name is Acinonyx jubatus
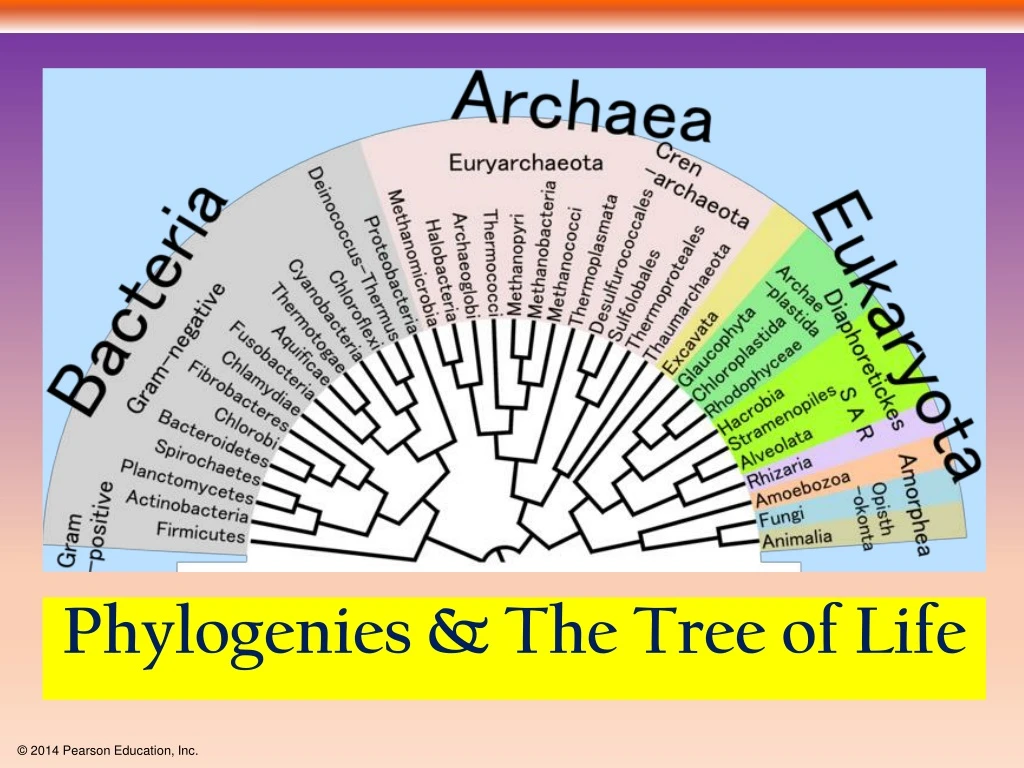
Domains- A Recent Development • Carl Woese proposed three domains based on differences in prokaryotes and eukaryotes. The prokaryotes were divided into two groups Archaea and Bacteria. • Making the domain, the most inclusive taxon.
Linking Classification and Phylogeny • The evolutionary history/relationship of a group of organisms can be represented in a branching phylogenetic tree • Phylogenies are based on evidence for evolution • Morphology and the fossil record • Embryology • DNA, RNA, and protein similarities
Evidence for Evolution Boot Camp: Fossil Record • Shows evolution & adaptation • Similar fossils in multiple layers (decent with modification) • Fossils that disappear (extinction)
Evidence for Evolution Boot Camp: Morphology Homologous structures: Similar internal features found in different groups of organisms due to adaptive radiation
Evidence for Evolution Boot Camp: Morphology • Analogous structures: • Structures with similar function, but different internal structure • Due to convergent evolution • Similar selection pressures due to similar environments • NOT a common ancestor
Evidence for Evolution Boot Camp: Morphology • Vestigial structures: • Structures used by an ancestor, but reduced in size and function in modern organism • Suggests a common ancestor • Descent with modification
Evidence for Evolution Boot Camp: Embryology • Embryology: • Study of early development • Similar early stage structures suggest similar ancestor • Longer two embryos appear similar, the more related they are
Evidence for Evolution Boot Camp: Genetic Comparisons • DNA/RNA sequences or amino acid sequences • Most convincing evidence for evolution & genetic relatedness
Talk with a Partner!!! Which organisms are the most closely related? Which organisms are most distantly related?
Talk with a Partner!!! Which organisms are the most closely related? Which organisms are most distantly related?
Talk with a Partner!!! Decide if each of the following pairs of structures more likely represent analogy or homology. A porcupine’s quills and a cactus’s spines A cat’s paw and a human’s hand an owl’s wing and a bee’s wing
Phylogenetic Tree Basics • Phylogenies are created using molecular evidence • Phylogenies can be updated or changed based on new information
Phylogenetic Tree Basics • Taxa: from Linnaean Classification • Branching point (node) represents where the ancestral lineage splits into two descendants • Each descendant lineage evolves independently of one another
Phylogenetic Tree Basics • An outgroup is a species or group of species that is closely related to the ingroup, the various species being studied • The outgroup is a group that has diverged before the ingroup
Phylogenetic Tree Basics • Length of line represents relative evolutionary time • A polytomy is a branch from which more than two groups emerge • Indicates an unresolved pattern of divergence
Phylogenetic Tree Basics • Basal taxon is a lineage that evolved early and remains unbranched • Sister taxa are groups that share an immediate common ancestor
Talk with a Partner!!! Locate & label the following features: branching point (node), polytomy, sister taxa, basal taxon
Figure 26.5 1 2 3 4 5 Branch point: where lineages diverge Taxon A Taxon B Sister taxa Taxon C Taxon D Taxon E ANCESTRAL LINEAGE Taxon F Basal taxon Taxon G This branch point forms a polytomy: an unresolved pattern of divergence. This branch point represents the common ancestor of taxa A–G.
Talk with a Partner!!! Locate the most recent ancestor of Taxa B & C. Where is the root point (the ancestor of the entire group)? Which taxon is the outgroup?
Talk with a Partner!!! Which taxon has the longest evolutionary history? Shortest? Which organisms are the most closely related? Which branches do you think can be flipped?
Rotating Branches The two phylogenetic trees illustrate the same evolutionary relationships. The vertical branches have been rotated without changing the evolutionary history.
Rotating Branches Redraw the phylogenetic tree with taxa B & C rotated & taxa D, E & F rotated
Rotating Branches C B F D E
Talk with a Partner!!! Which of the trees shown depicts an evolutionary history different from the other two?
Work with a Partner!!! Which of the trees shown depicts an evolutionary history different from the other two?
Work with a Partner!!! Suppose new evidence indicates that taxon E is the sister taxon of a group consisting of taxa D & F. Redraw the tree accordingly.
Talk with a Partner!!! Suppose that two species, A and B, have similar appearances but very divergent gene sequences, whereas species B and C have very different appearances but similar gene sequences. Which pair of species is more likely to be closely related: A and B or B and C? Explain.
Putting it together!!! This phylogenetic tree represents the “true” evolutionary history of elephants. The nodes and length of a phylogenetic lineage indicate the time of divergent events. Also any organism not shown across the top of the page is an extinct species.
What We Can and Cannot Learn from Phylogenetic Trees • Phylogenetic trees show patterns of descent, not phenotypic similarity • Phylogenetic trees do not indicate when species evolved or how much change occurred in a lineage • Phylogenetic trees DO NOT say that one taxon evolved into the next…only that they share a common ancestor
Cladograms are a Type of Phylogenic Tree • Cladistics groups organisms by common descent • A clade is a group of species that includes an ancestral species and all its descendants • Clades can be nested in larger clades, but not all groupings of organisms qualify as clades • Cladograms are based on shared derived characters, an evolutionary novelty unique to each clade
A true clade is a monophyletic group that contains a common ancestor and all of its descendants. • A paraphyletic group is one that has a common ancestor but does not contain all of the descendants. • A polyphyletic group does not have a unique common ancestor for all the descendants.
Figure 26.11 Paraphyletic group Common ancestor of even-toed ungulates Other even-toed ungulates Hippopotamuses Cetaceans Seals Bears Other carnivores Polyphyletic group
Molecular clocks help track evolutionary time • To extend phylogenies beyond the fossil record, we must make an assumption about how molecular change occurs over time • A molecular clock uses constant rates of evolution in some genes to estimate the absolute time of evolutionary change • Molecular clocks are calibrated against branches whose dates are known from the fossil record • Individual genes vary in how clocklike they are
Molecular clocks help track evolutionary time • Homologous structures are coded by genes with a common origin. These genes may mutate but they still retain some common and ancestral DNA sequences. • Genomic sequencing using computer software and systematics are able to identify these molecular homologies. • The more closely related two organisms are, the more their DNA sequences will be alike. • The colored boxes represent DNA homologies.
Molecular clocks help track evolutionary time • The molecular clock hypothesis states: Among closely related species, a given gene usually evolves at reasonably constant rate. • These mutation events can be used to predict times of evolutionary divergence. • Therefore, the protein encoded by the gene accumulates amino acid replacements at a relatively constant rate.
Molecular clocks help track evolutionary time • The amino acid replacement for hemoglobin has occurred at a relatively constant rate over 500 million years. • The slope of the line represents the average rate of change in the amino acid sequence of the molecular clock. • Different genes evolve at different rates and there are many other factors that can affect the rate.
Molecular clocks help track evolutionary time • Molecular clocks can be used to study genomes that change rather quickly such as the HIV virus. • Using a molecular clock, it as been estimated that the HIV virus entered the human population in 1960’s and the origin of the virus dates back to the 1930’s.
All Life is connected. Molecular clocks provide the date of the Origin of Life