Download
1 / 20
200 likes | 338 Vues
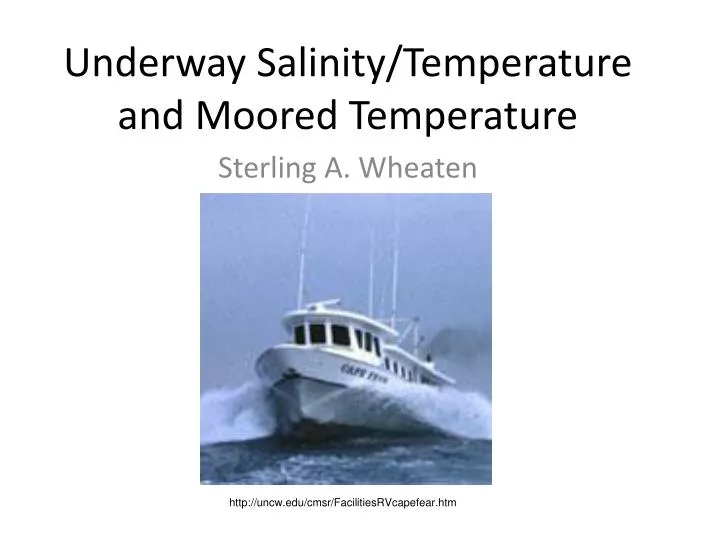
Underway Salinity/Temperature and Moored Temperature. Sterling A. Wheaten. http://uncw.edu/cmsr/FacilitiesRVcapefear.htm. Background: Measurement Stations. In both cruises we made various measurements along the Lower Cape Fear estuary at M18, M23, M35, M42, M54, M61, and HB.

E N D
Underway Salinity/Temperature and Moored Temperature Sterling A. Wheaten http://uncw.edu/cmsr/FacilitiesRVcapefear.htm
Background: Measurement Stations In both cruises we made various measurements along the Lower Cape Fear estuary at M18, M23, M35, M42, M54, M61, and HB. http://uncw.edu/cmsr/aquaticecology/laboratory/LCFRP/index.htm
Background: Continuous Measurements Temperature and Salinity were measured every 5 seconds during both cruises using a Sea-Bird 21 thermosalinograph. http://www.seabird.com/pdf_documents/manuals/21_025.pdf
Background: Thermosalinograph Plots TSG plot: September 14, 2009 Y axis: time (in seconds) X axis: Salinity and Temp (0C) Green line is Temperature Blue line is Salinity Cruise 1 TSG plot of Lower Cape Fear Estuary.Septmeber 14, 2009
Important Concepts: Positioning of Stations Carroll CTD Presentation. 2008
Important Concepts: Positioning of Stations Heading up river, salinity decreases Surface temperature stays relatively constant http://uncw.edu/cmsr/aquaticecology/laboratory/LCFRP/index.htm
Data Obtained: Cruise 1 Salinity vs. Time, M18 to HB Salinity Time (seconds)
Data Obtained: Cruise 1 Data on graph where salinity remained constant implies a stop at a station. This is verified upon comparison to the CTD data, as seen in the next slide.
Data Obtained: Cruise 1 Underway M18 to HB with CTD data M18: 30.5 M23: 28.08 Salinity M35: 20.05 M42: 17.26 M54: 15.53 M61: 12.72 HB: 6.04 Time (seconds)
Data Obtained: Cruise 2 Salinity vs. Time, M18 to HB Salinity Time (seconds)
Data Obtained: Cruise 2 Underway M18 to HB with CTD data M18: 29.12 M23: 26.5 M35: 23.06 M42: 17.45 M54: 15.29 M61: 13.45 HB: 5.98 Shorter time to take measurements resulted in the vessel not being as stationary. This data does not correlate as well with the CTD data.
Data Obtained: Cruise 1 vs. Cruise 2 Salinity Miles Inland
Data Obtained: Cruise 1 vs. Cruise 2 • In comparison, Cruise 2 had a lower salinity initially at M18. • Station stops during Cruise 2 were much shorter, resulting in less distinction between stations. • Cruise 1 had a significant decrease in salinity from M23 to M34 as compared to Cruise 2.
Moored Temperature Device at HB A temperature data logger was left at M35 and HB on September 14, 2009 and collected October 26, 2009 (6 weeks) • The data logger left at M35 was swept away and could not be found upon collection The instrument used was a TidBit v2 Data Logger • precision sensor for ±0.2 °C accuracy • Waterproof to 300m • Set to record temp. every 15 minutes http://onsetcomp.com/products/data-loggers/utbi-001
Moored Temperature Device at HB At left, Dr. Bingham and Sterling prepare the TidBit v2 for mooring and at right, leaving the anchored data logger with buoy attached at station M35. September 14, 2009
Moored Temperature Device at HB Above, from clockwise, finding, collecting, and observing the moored TidBit v2 at station HB. October 16, 2009
Moored Temperature Device at HB Data obtained by TidBit v2 at station HB 29 27 25 23 Temperature, °C 21 19 17 15 14 16 18 20 22 24 26 28 30 2 4 6 8 10 12 14 16 18 20 22 24 September October
Moored Temperature Device at HB Data Interpretation There is a large minimum in the temperature around October 20 The decreasing trend in the temperature as time increased was due to seasonal change. The data points oscillate, which are representative of the semidiurnal tide.
Moored Temperature Device: 48 hour period The oscillations in the data are from the semidiurnal tide. Below shows data obtained from September 17-18, 2009. Temperature, oC 12 6 12 6 12 6 12 6 12 am pm am pm September 17 September 18
Conclusions: TSG data from both trips showed a decrease in salinity as we headed up river and minimal surface temperature changes. The data from the moored temperature device showed oscillations due to the semidiurnal tide and over the 6 weeks, the temperature followed a decreasing trend due to seasonal change.