Download
1 / 41
540 likes | 972 Vues
Topography:. Mapping the Surface of the Earth. Facts:. The Earth ’ s surface is constantly changing. Forces responsible for these changes: Plate Motion (caused by convection currents), which create and destroy features

E N D
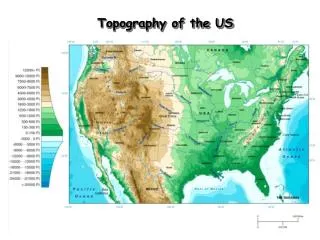
Topography: Mapping the Surface of the Earth
Facts: • The Earth’s surface is constantly changing. • Forces responsible for these changes: • Plate Motion (caused by convection currents), which create and destroy features • Hotspots (underground magma chambers), which can create and destroy features • Erosion & Weathering, which break down the surface of the Earth • Topographic maps are one way to monitor these changes. • Where we’re going next?!? How does life respond to the changes to Earth’s surface?
At the end, you should know: • What is a topographic map? How is it different from a “typical” map? • What are contour lines? • What are contour intervals?
What are topographic maps? • Represent the differences in elevation • Show the dimension of height in addition to the “typical” map features (cities, waterways, etc.) • Useful for representing to scale Earth’s features on a (typically) two dimensional surface
Key Feature of Topographic Maps: • Contour lines show the changes in elevation. • Contour intervals: the space between contour lines, giving indication as to the steepness of an area. • The further apart the contour lines, or the larger the interval, the more gradual the slope. • Or, the closer together the contour lines, and the smaller the space between them, the steeper the land.
Key Feature of Topographic Maps: • Sea level is represented as 0 feet, kilometers, miles, etc. • If an elevation changes and goes downward, it is represented by a contour line with “spokes” or “dashes.” For example: … and/or it might show a negative number. -20 -10 0
How about a map of Mt. St. Helen’s??? • Examine the topography of Mt. St. Helens before the 1980 eruption. • The shaded portion of the map represents glaciers. • Complete questions for Map A…
How about a map of Mt. St. Helens??? • Map A: 1. You should have drawn a mountain. 2. The highest point (actually points) is about 2800 meters.
How about a map of Mt. St. Helens??? • Let’s analyze this topo-graphic map together…
How about a map of Mt.St. Helens??? • Which portion of the mountain is steeper, the slope between 1500-2000 meters, or the slope between 2000-2500 meters? • How do you know?
How about a map of Mt. St. Helens??? • Which portion of the mountain is steeper, the slope between 1500-2000 meters, or the slope between 2000-2500 meters? It is steeper between 2000-2500 meters. • How do you know? The contour lines are closer together.
How about a map of Mt. St. Helens??? • What is the contour interval on this map?
How about a map of Mt. St. Helens??? • What is the contour interval on this map? 100 meters
How about a map of Mt. St. Helens??? • What is the lowest elevation shown on the map of Mt. St. Helens?
How about a map of Mt. St. Helens??? • What is the lowest elevation shown on the map of Mt. St. Helens? Lowest = 1300 meters
How about a map of Mt. St. Helens??? Path B • If you were to hike up part of Mt. St. Helens, which route would be easier (less exhausting) to follow? • Why? Path A
How about a map of Mt. St. Helens??? Path B • If you were to hike up part of Mt. St. Helens, which route would be easier (less exhausting) to follow? Path B would be an easier path. • Why? It is not as steep - the contour lines are not as close together; the contour interval (space between the contour lines) is larger. Path A
How about a map of Mt. St. Helens??? B • Note the locations of A, B, and C on the map. • If this volcano were to erupt at point A, would the lava likely flow to point B or point C? • Explain why. A C
How about a map of Mt. St. Helens??? B • If this volcano were to erupt at point A, would the lava likely flow to point B or point C? It would flow towards point C since it is downhill from the eruption point. • Explain why. The lava wouldn’t flow uphill over the peak to reach point B. A C
How about a map of Mt. St. Helens? Before 1980 Eruption After 1980 Eruption • Shown here are two topographic maps of Mt. St. Helens. The “after” map shows how it appears after the May, 1980 eruption. Map B shows the topography of the mountain as it appears today. Answer the questions related to this map.
How about a map of Mt. St. Helens? After 1980 Eruption • Map B • There is a large “chunk” missing from the north side of the volcano. • Now, the highest portion of the volcano only reaches 2400 meters. • The volcano is 400 meters lower than before the eruption. • The crater is larger than before the eruption.
What is the difference between the two maps? Before 1980 Eruption After 1980 Eruption • The biggest difference in the geography of this area is the huge crater that formed from the eruption (shown by the dashed line on the “after” map). The top portion of the mountain literally blew off from the violent eruption.
If we could see the side view… Before After
Timeout! • Let’s take a few minutes to wrap up any activities from Friday that you didn’t get complete. • And / Or There are some extension activities that will help you prepare for the mastery check tomorrow • Regroup with about 5 minutes remaining in class to check the last portion of the homework together.
Let’s Practice: How well can you identify features on a topographic map?
Let’s Practice: Which letter represents the… Cliff?
Let’s Practice: Which letter represents the… Cliff? C
Let’s Practice: Which letter represents the… Rock Quarry?
Let’s Practice: Which letter represents the… Rock Quarry? D
Let’s Practice: Which letter represents the… River?
Let’s Practice: Which letter represents the… River? B
Let’s Practice: Which letter represents the… Mountain Peak?
Let’s Practice: Which letter represents the… Mountain Peak? F
Let’s Practice: Which letter represents the… Ocean?
Let’s Practice: Which letter represents the… Ocean? A
Let’s Practice: Which letter represents the… Island?
Let’s Practice: Which letter represents the… Island? G
Let’s Practice: Which letter represents the… Steep Quarry Wall?
Let’s Practice: Which letter represents the… Steep Quarry Wall? E
First thing you need to know is the contour interval? Let’s Practice: How well can you label the elevation on a topographic map? 0 10
Let’s Practice: How well can you label the elevation on a topographic map? 50 20 10 60 50 40 30 20 0 10 10 -10 0