Download
1 / 54
540 likes | 804 Vues
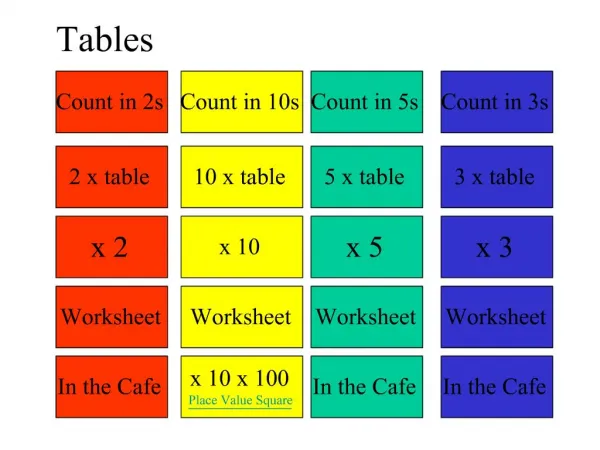
Tables. Types of Tables. There are two types of tables used in web pages: data tables; layout tables. You must ensure that you always use structural markup correctly for the type of table you are using. Proportional Sizing.

E N D
Types of Tables • There are two types of tables used in web pages: • data tables; • layout tables. • You must ensure that you always use structural markup correctly for the type of table you are using.
Proportional Sizing • Use proportional sizing (% values) where possible for all tables, data or layout • This allows the table to be resized relative to screen resolution (tables with absolute sizes do not transform gracefully for users with smaller screens or lower resolutions). • Use proportional sizing, wherever possible to create a fluid width
Data Tables • In general, data tables require more careful design and coding to ensure accessibility • Long, complex data tables should be avoided as they are difficult for everyone (and difficult to code correctly).
Data Tables - Simplicity • Data tables should appear in the simplest form possible - this makes it easier for all people to understand, but particularly for those using adaptive technology (e.g. screen reader users). • Special HTML code also assists the accessibility of tables.
Layout Tables • Layout tables should be used sparingly (ideally you should be using CSS • If using layout tables, ensure they are simple and are designed so that they present information in the correct order for quick access to key content on the page.
Data Tables • Use the most simple data table possible: • Split single, large, complex data tables into multiple, smaller, simple ones: • The vast majority of complex tables can be made into simple tables • If possible, design so that the table reads out logically row by row and the data values themselves are indicative of their values (see the 'important birthdays' example); • Avoid unnecessary rowspan and colspan if possible: • Some screen readers have problems with these although modern ones can now cope.
Code for added accessibility: Always use <th> to identify header rows and columns, use <abbr> to abbreviate (or replicate) the titles: • Some screen readers (most modern ones) can use this information to read out the header rows and columns before the data - this helps avoid people getting lost in long tables;
Row and Column Headers • Explicitly associate row and column headers (<th>) with data cells • Use scope (easiest for simple tables), or • Use headers and id;
Sample Code • <TABLE BORDER="1" SUMMARY="This table lists amount of money allocated and spent by Schools in the Year 2010"> • <TR> • <TH id="t1“>School</TH> • <TH id="t2">Amount Allocated</TH> • <TH id="t3">Amount Spent</TH> • </TR> • <TR> • <TD headers="t1“>School of Computing</TD> • <TD headers="t2">e193,088</TD> • <TD headers="t3">e185,921</TD> • </TR> • <TR> • <TD headers="t1">School of Physics</TD> • <TD headers="t2">e900,252</TD> • <TD headers="t3">e871,857</TD> • </TR> • </TABLE>
Using ID • Note the use of ID • Means the header for every cell is read out
If you were Listening • You would hear: • This table lists amount of money allocated and spent by Schools in the Year 2010 • “School” School of Computing • “Amount Allocated” e193,088 • “Amount Spent” e185,921 • “School” School ofPhysics • “Amount Allocated” e900,252 • “Amount Spent” e871,857
Repetition • Avoid excessive repetition using abbr • This table is small but if it were larger people would get very tired of hearing Amount Allocated etc over and over again • Shorten it by abbreviation but do it to something meaningful e.g. Allocation
<TH id="t1“>School</TH> • <TH id="t2“ abbr=“Allocation">Amount Allocated</TH> • <TH id="t3“ abbr=“Spend">Amount Spent</TH>
Caption and Summary Use CAPTION or SUMMARY element to summarize table contents. The CAPTION displays on the Web page. SUMMARY doesn't display in the browser, but screen readers will read the content aloud. Use <caption> to describe the nature of the table; Use <summary> to explain the contents of the table and provide orientation to people who listen to the table.
Examples • <TABLE BORDER="1" SUMMARY="This table lists amount of Goals Scored in the 2010 Season by Premier Division Players"> • <CAPTION>Leading Scorers 2010 Campaign</CAPTION>
Caption and Summary Elements • The caption displays directly above the table, like a title. • Visitors with visual browsers won't see the summary unless they look at your source code, but screen readers will read it aloud before reading the table's contents.
Example code of a simple table showing use of summary, <caption>, <th>, abbr, and scope • Due to Donal Rice CEUD • <table summary="Important childrens birthdays to remember. First column: childs name, second: childs age, third: date of birthday" > • <caption>Important Birthdays</caption>
Rest of Table Code <tr> <th scope="col" abbr="Name" >Name</th><th scope="col" abbr="Age" > Age</th> <th scope="col" abbr="Date" >Date of Birthday</th> </tr> <tr> <th scope="row">Emily</th> <td>8 years</td> <td>3 September</td> </tr> <tr> <th scope="row">Jack</th> <td> 12 years</td> <td> 28 April</td> </tr> </table>
More Table Elements • Note: There are more table elements to help structure tables, namely <tbody>, <thead>, <tfoot>, col, colgroup, axis • Many of these are only required for complex tables (which you should try to avoid)
Layout Tables • Web sites that use tables to control layout often look great and are easy to interpret visually. • Still, the complex structure of some layout tables causes problems for visitors using assistive technologies like screen readers. • Carefully structure your layout tables and add navigation cues to make them accessible to all visitors.
Layout Tables • Generally • Ensure correct readout order, • Avoid complicated nesting, • Describe with summary attribute
Use CSS • Ideally you should use CSS for layout but, in the real world, the use of tables is often far easier to accomplish. • In addition, you may be restricted to the use of tables if you are adapting an existing site or if layout tables are a restriction of the content management system you are using. • Layout table usage is OK as long as accessibility is kept in mind.
Avoid complex and nested tables • Aim for as simple a structure as possible; • Choose simple stacked tables rather than single complex or multiple nested tables.
Ensure the linear reading order makes sense • Tables read out from top left to bottom right, row by row; • Test to ensure that a logical order is given.
Example This is Good Visually- Makes Sense
Reads Out • A screen Reader Reads this out as • How We Will Will This Have Read To Out See • In other Words Left To Right ,Row by Row
Word Wrapping • Some older screen readers don't understand word wrapping and read through table cells line by line - like you might read a page in a book. • When two cells are side by side on a Web page, the screen reader would read the first line of Cell 1, the first line of Cell 2, the second line of Cell 1, and so on.
Consider • Example due to Larisa Thomason • Look at the following table
What an old technology user might hear • A visitor using very old technology would hear this rather scary dietary recommendation: • "Adults should eat lots of fruits, School Age Children grains, and vegetables each day. Growing children need a diet rich in calcium and protein.
Do not use structural tags for layout or styling purposes - use CSS instead: • e.g. do not use <th> to get centered and bold text.
Use the summary attribute to describe the purpose of the section • Example: • summary="page contents"; • summary="main navigation"; • Use summary="" if description will not add useful information (i.e. don't over do the summary descriptions.)
Approaches to Linearization Checking • Check it yourself. Set the table borders to display, print out the page, put a ruler under the first line of the page, and read it aloud, cell by cell. • To check if your tables linearize well, use the online accessibility validatorthe wave or Opera, which allows you to turn off tables completely. • Check it with a real screen reader.
Tablin • Let Tablin Analyze It. • Tablin is a table linearization tool developed by the WAI Evaluation and Repair group. • It analyzes your tables then shows you on screen how a screen reader might organize the cells.
Provide Quick Access To Content • If you aren't exactly thrilled with the idea of tearing apart every page in your site to correct linearization problems, then relax. • There is a relatively simple workaround that gives disabled people easier access to the content they want without ruining your visual design.
Anchor tags • Create anchor tags to mark where page content begins and where your text navigation links begin. Then place links at the top of your page - use a text link or a single-pixel gif - to give visitors the option to skip directly to the main content or navigation sections.
Example • The anchor tag for navigation might look like this: • <a name="navigation">navigation text or image</a> • Then at the top of the page, you'd put: • <a href="#navigation">Skip to navigation links</a>
Table hack using gifs • If you don't like the look of the text links, use single-pixel gifs to add the links. They'll be invisible to most visitors, but easily accessible to visitors using screen readers. This method isn't a complete fix, but you can use it to quickly make existing pages more accessible. • To put content first before a column of navigation, put an invisible gif in the first cell, then rowspan=2 in the next cell (containing the content). • The next row then contains the menu (see examples).
The table hack • Presents content first even though visually there is a left column menu: • <table> <tr> <td>(put a single pixel gif here)</td> <td rowspan="2">Page Content</td> </tr> <tr> <td>The navigation menu goes here</td> </tr> </table>
Using the headers Attribute • The final technique for making tables accessible is the most rigorous and programmatic. HTML 4.0 introduced the headers attribute for table cells. With the headers attribute you can specify any other cell or cells as the heading information for a given (data) cell. • The idea is simple. You attach an id attribute to any cell you want to be a header cell. Then, add the id's of each header cell to the headers attribute of a data cell. • For a simple case, let's say the id's of the column headers are c1, c2, c3, and c4 and the id's of the row headers are r1, r2, r3, and r4. Then the cell at row 3, column 2 would have headers="r3 c2" or the other way around, headers="c2 r3" if that sounded better.
For many simple tables , assistive technology can figure out which is the header information. But in a table like the Travel Expense Report that follows, that is nearly impossible. • (This table is from the Web Accessibility Initiative, Techniques for Web Content Accessibility Guidelines 1.0 (http://www.w3.org/TR/WCAG10-HTML-TECHS/#identifying-table-rows-columns)
HTML Code for this • Here is sample HTML mark up for the data cells of this table using the headers attribute. The convention that is used is c1, c2, c3, ... are the id's of the column headings and r1, r2, r3, ... are the id's of the row headings.
Html Code Part 1 <table border="1"> <caption>Travel Expense Report</caption> <tr> <td></td> <th id="c2">Meals</th> <th id="c3">Hotels</th> <th id="c4">Transport</th> <td id="c5">subtotals</td></tr> <tr> <th id="r2">San Jose</th> <td></td><td></td><td></td><td></td> </tr>
Part 2 <tr> <td id="r3" >25-Aug-97</td> <td headers="c2 r2 r3" bgcolor="#ffff00">37.74</td> <td headers="c3 r2 r3">112.00</td> <td headers="c4 r2 r3">45.00</td> <td></td></tr> <tr> <td id="r4">26-Aug-97 <td headers="c2 r2 r4">27.28</td> <td headers="c3 r2 r4">112.00</td> <td headers="c4 r2 r4">45.00</td>
And to finish ... <tr><th id="r10">Totals</th> <td headers="c2 r10">196.27</td> <td headers="c3 r10">442.00</td> <td headers="c4 r10">162.00</td> <td headers="c5 r10">800.27</td></tr> </table>
Highlighted Cell • The highlighted cell with the value 37.74, for example, is associated with the date "25-Aug-97" (id="r3"), the city "San Jose," (id="r2") and expense item "Meals" (id="c2"). • To make it readable, the subject cell is coded: <td headers="c2 r2 r3">37.74</td> • Assistive technology might then read this cell "Meals, San Jose, 25-Aug-97, 37.74" or "37.74 ,Meals, San Jose, 25-Aug-97."