Download

1 / 17
170 likes | 245 Vues
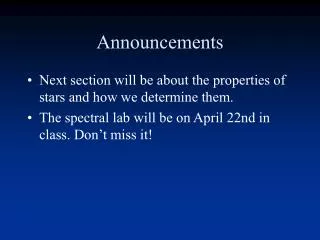
Announcements:. Homework 10: Due next Thursday (4/25) Assignment will be on the web by tomorrow night. 18. 17. 16. 15. e. m. i. 14. T. n. 13. r. u. B. 12. 11. 10. 9. 1. 2. 3. 4. Fabric. Vertical spread of data points within each oval is one type of variability.

E N D
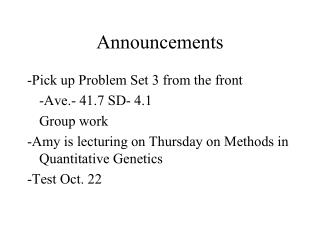
Announcements: • Homework 10: • Due next Thursday (4/25) • Assignment will be on the web by tomorrow night.
18 17 16 15 e m i 14 T n 13 r u B 12 11 10 9 1 2 3 4 Fabric Vertical spread of data points within each oval is one type of variability. Vertical spread of the ovals is another type of variability.
Suppose there are k treatments and n data points.ANOVA table: ESTIMATE OF “ACROSS FABRIC TYPE” VARIABILITY Source Sum of Meanof Variation df Squares Square F P Treatment k-1 SST MST=SST/(k-1) MST/MSE Error n-k SSE MSE=SSE/(n-k) Total n-1 total SS ESTIMATE OF “WITHIN FABRIC TYPE” VARIABILITY P-VALUEFOR TEST OF All Means equal. (REJECT IF LESS THAN a) “SUM OF SQUARES” IS WHAT GOES INTO NUMERATOR OF s2: “(X1-X)2 + … + (Xn-X)2”
One-way ANOVA: Burn Time versus Fabric Analysis of Variance for Burn Time Source DF SS MS F P Fabric 3 109.81 36.60 27.15 0.000 Error 12 16.18 1.35 Total 15 125.99 Explaining why ANOVA is an analysis of variance: MST = 109.81 / 3 = 36.60 Sqrt(MST) describes standard deviation among the fabrics. MSE = 16.18 / 12 = 1.35 Sqrt(MSE) describes standard deviation of burn time within each fabric type. (MSE is estimate of variance of each burn time.) F = MST / MSE = 27.15 It makes sense that this is large and p-value = Pr(F4-1,16-4 > 27.15) = 0 is small because the variance “among treatments” is much larger than variance within the units that get each treatment. (Note that the F test assumes the burn times are independent and normal with the same variance.) For test: H0: m1=m2=m3=m4
It turns out that ANOVA is a special case of regression. We’ll come back to that in a class or two. First, let’s learn about regression (chapters 12 and 13). • Simple Linear Regression example: Ingrid is a small business owner who wants to buy a fleet of Mitsubishi sigmas. To save $ she decides to buy second hand cars and wants to estimate how much to pay. In order to do this, she asks one of her employees to collect data on how much people have paid for these cars recently. (From Matt Wand)
Regression Plot 9000 8000 7000 6000 5000 Price ($) 4000 3000 Data: Each point is a car 2000 1000 0 6 7 8 9 10 11 12 13 14 15 Age (years)
Plot suggests a simple model: Price of car = intercept + slope times car’s age + error or yi = b0 + b1xi + ei, i = 1,…,39. Estimate b0 and b1. Outline for Regression: • Estimating the regression parameters and ANOVA tables for regression • Testing and confidence intervals • Multiple regression models & ANOVA • Regression Diagnostics
Plot suggests a model: Price of car = intercept + slope times car’s age + error or yi = b0 + b1xi + ei, i = 1,…,39. Estimate b0 and b1 with b0 and b1. Find these with “least squares”. In other words, find b0 and b1 to minimize sum of squared errors: SSE = {y1 – (b0 + b1 x1)}2 + … + {yn – (b0 + b1 xn)}2 See green line on next page. Each term is squared differencebetween observed y and the regression line ((b0 + b1 x1)
Regression Plot Price = 8198.25 - 385.108 Age S = 1075.07 R-Sq = 43.8 % R-Sq(adj) = 42.2 % 9000 This line has lengthyi – b0 – b1xi for some i 8000 7000 6000 e 5000 c i r P 4000 Squared lengthof this line contributesone term to Sum of Squared Errors (SSE) 3000 2000 1000 0 6 7 8 9 10 11 12 13 14 15 Age
Regression Plot Do Minitab example S = 1075.07 R-Sq = 43.8 % R-Sq(adj) = 42.2 % 9000 General Model: Price = b0 + b1 Age + error Fitted Model: Price = 8198.25 - 385.108 Age 8000 7000 6000 5000 Price ($) 4000 3000 2000 1000 0 6 7 8 9 10 11 12 13 14 15 Age (years)
Regression parameter estimates, b0 and b1, minimize SSE = {y1 – (b0 + b1 x1)}2 + … + {y – (b0 + b1 xn)}2 Full model is yi = b0 + b1 xi + ei Suppose errors (ei’s) are independent N(0, s2). What do you think a good estimate of s2 is? MSE = SSE/(n-2) is an estimate of s2. Note how SSE looks like the numerator in s2.
(I divided price by $1000. Think about why this doesn’t matter.) Source DF SS MS F P Regression 1 33.274 33.274 28.79 0.000 Residual Error 37 42.763 1.156 Total 38 76.038 Sum of Squares Total = {y1 –mean(y)}2 + … + {y39 – mean(y)}2= 76.038 Sum of Squared Errors = {y1 – (b0 + b1 x1)}2 + … + {y – (b0 + b1 xn)}2= 42.763 Sum of Squares for Regression = SSTotal - SSE What do these mean?
Regression Plot Price = 8198.25 - 385.108 Age S = 1075.07 R-Sq = 43.8 % R-Sq(adj) = 42.2 % 9000 Overall mean of $3,656 Regression line 8000 7000 6000 e 5000 c i r P 4000 3000 2000 1000 0 6 7 8 9 10 11 12 13 14 15 Age
(I divided price by $1000. Think about why this doesn’t really matter.) Source DF SS MS F P Regression 1=p-1 33.274 33.274 28.79 0.000 Residual Error 37=n-p 42.763 1.156 Total 38=n-1 76.038 p is the number of regression parameters (2 for now) SSTotal = {y1 –mean(y)}2 + … + {y39 – mean(y)}2= 76.038 SSTotal / 38 is an estimate of the variance around the overall mean. (i.e. variance in the data without doing regression) SSE = {y1 – (b0 + b1 x1)}2 + … + {y – (b0 + b1 xn)}2= 42.763 MSE = SSE / 37 is an estimate of the variance around the line. (i.e. variance that is not explained by the regression) SSR = SSTotal – SSE MSR = SSR / 1 is the variance the data that is “explained by the regression”.
(I divided price by $1000. Think about why this doesn’t really matter.) Source DF SS MS F P Regression 1=p-1 33.274 33.274 28.79 0.000 Residual Error 37=n-p 42.763 1.156 Total 38=n-1 76.038 p is the number of regression parameters A test of H0: b1 = 0 versus HA: parameter is not 0 Reject if the variance explained by the regression is high compared to the unexplained variability in the data. Reject if F is large. F = MSR / MSE p-value is Pr(Fp-1,n-p > MSR / MSE) Reject H0 for any a less than the p-value (Assuming errors are independent and normal.)
R2 • Another summary of a regression is: R2 = Sum of Squares for Regression Sum of Squares Total 0<= R2 <= 1 This is the percentage of the of variation in the data that is described by the regression.
Two different ways to assess “worth” of a regression • Absolute size of slope: bigger = better • Size of error variance: smaller = better • R2 close to one • Large F statistic