Download
1 / 41
440 likes | 741 Vues
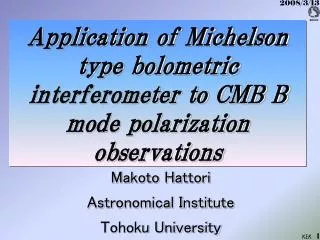
The Waves Michelson Interferometer (WaMI): Observing Atmospheric Dynamics above the Stratopause. W.E. Ward 1 , W.A. Gault 2 , A. Bell 3 , N. Rowlands 3 and G.G. Shepherd 2 1 Dept. of Physics, University of New Brunswick, Fredericton Canada ,

E N D
The Waves Michelson Interferometer (WaMI): Observing Atmospheric Dynamics above the Stratopause W.E. Ward1, W.A. Gault2, A. Bell3, N. Rowlands3 and G.G. Shepherd2 1Dept. of Physics, University of New Brunswick, Fredericton Canada, 2Centre for Research in Earth and Space Science, York University, North York 3EMS Technologies Canada, Inc., Ottawa wward@unb.ca Also acknowledge the work of D.Y Wang and M. Kowalski W.E. Ward, Waves Michelson Interferometer
Outline • Motivation for WaMI measurements. • Heritage • Instrument concept • WaMI configuration • Emission characteristics/observables • Data analysis • Orbital considerations W.E. Ward, Waves Michelson Interferometer
Motivation for Observations • The Earth’s atmosphere is a complex system with strong coupling between various layers and latitudes. • Although observations of constituents provide insights into the chemistry and energetics of the atmosphere, observations of the dynamics (wind, temperature, waves) are needed to move beyond a zonal mean description of the atmosphere and understand the reasons behind observed constituent distributions. • WaMI is a field widened Michelson interferometer designed to provide observations of wind, temperature and constituents thereby providing insights into the large scale dynamics at the stratopause and above. W.E. Ward, Waves Michelson Interferometer
Examples of Coupling • Zonal mean constituent distributions depend on systematic transports as well as photochemistry and hence require an understanding of waves of all scales and the mean background meridional motions. • The Quasi-biennial and Semi-annual oscillations occur through wave/mean flow interactions requiring observations of waves of a number of scales. • Patterns of variability in the stratosphere (lower mesosphere?) which propagate downward and precede the establishment of certain patterns of variability in the troposphere. • Mesospheric inversion layers • Waves transport constituents vertically and change the local environment and hence concentrations and mixing ratios. W.E. Ward, Waves Michelson Interferometer
Annual Cycle of Tidal Temperature Amplitude W.E. Ward, Waves Michelson Interferometer
Figure courtesy of J. Kafkalides W.E. Ward, Waves Michelson Interferometer
Observational Issues • Ideally we would like to systematically monitor as many parameters in the same volume of air as possible. • Spatial inhomogeneities. • Simultaneous presence of many spatial and spectral features. • Filtering action of the observation technique • Spatial and temporal cadence of the measurements. • Different techniques monitor different atmospheric parameters. Typically multiple instrument platforms are used to satisfy observation strategies. W.E. Ward, Waves Michelson Interferometer
Interferometer Advantages • Interferometers used in high resolution mode can provide simultaneous information on line width, wavelength, radiance and polarization. • Imaging through an interferometer is equivalent to a multi-measurement, multi-channel device. • Each channel can sample spatial information and/or spectral information. • For the field widened Michelson interferometer such as WaMI • Radiance - constituent information, rotational temperature • Visibility – Spectral distribution (linewidth, T) • Phase – wavelength (wind, Doppler shift) • In atmospheric applications this capability has been termed “spectral imaging” (G.G. Shepherd, 2002) and in astronomical applications “tridimensional spectroscopy” (Compte and Marcelin, 1994). W.E. Ward, Waves Michelson Interferometer
Heritage • The field-widened Michelson interferometer is a particularly useful implementation for atmospheric observations. • The large throughput of this instrument allows observation of fainter emissions and/or more rapid measurements. • Development initiated by Gordon Shepherd in the 1960’s. • To date the most sophisticated implementation is the Wind Imaging Interferometer (WINDII) on UARS. • Design of a mesospheric instrument (WaMI: Waves Michelson Interferometer) was initiated in the late 1980’s and formalized in the early 1990’s. • A stratospheric instrument design (SWIFT: Stratospheric Wind Interferometer for Transport studies) was initiated in the early 1990’s and formalized in the late 1990’s. W.E. Ward, Waves Michelson Interferometer
Wind Imaging Interferometer (WINDII) • WINDII (G.G. Shepherd, P.I.) flew for over 10 years on NASA’s UARS satellite. • It measured wind, temperature and emission rate in the mesopause region and above using O(1S), OH and O2 airglow emissions. Mounting WINDII on UARS W.E. Ward, Waves Michelson Interferometer
Field-widened Michelson interferometer The use of refractive material causes the combined rays to emerge co-linearly. This causes the phase to change slowly over the field of view, which in turn allows an imaging detector to be used. The phase images of the atmosphere are converted to wind images. W.E. Ward, Waves Michelson Interferometer
Design Considerations Instrument designs are specific to the application and glasses are chosen to satisfy: • The field widened condition: little variation in the instrument phase across the field • Thermal compensation: ensuring that the optical path of the interferometer is independent of temperature • Achromaticity: ensuring that the field widened condition remains valid over a range of wavelengths. W.E. Ward, Waves Michelson Interferometer
Phase and Phase Gradient W.E. Ward, Waves Michelson Interferometer
What is WaMI? • WaMI is a combination of WINDII and a near-IR Michelson and includes both a visible and near-IR channel. • Measurements will be taken with both channels simultaneously. • Target emissions are selected to provide wind and temperature measurements from 45 to ~180 km • The mirror is segmented so that phase determinations will not necessarily need mirror stepping. • The instrument has a mass of ~40 kg, the technology is mature and the instrument cost is ~$15M Cdn. W.E. Ward, Waves Michelson Interferometer
Limb viewing geometry Image field 6 degree square (180 km x 180 km) made up of 120x120 pixels each 1.5 km high W.E. Ward, Waves Michelson Interferometer
Rotatable pointing mirror selects FOV direction Light enters WAMI through baffle tubes Telescope defines FOV and projects light into Michelson MCT (IR) detector Filter wheels CCD Fold mirror (fold not shown) Wide-field Michelson modulates emission lines Dichroic beamsplitter separates light into visible and IR channels Second telescope forms image of Michelson mirrors at prisms (P) WAMI Optical Configuration • - A single 6o FOV pointable • in 6 external viewing directions • - 4 side views (±45o, ±135o) • - 2 calibration views (fore & aft) • - Reimaging optics, 5 cm dia • - Similar but simpler optical • configuration compared to • WINDII, lower f/# • two channels 1.27 and 0.558 mmeach with a filter wheel • filter wheel gives flexibility for calibration and O2 line selection P P WAMI: Wind and temperature measurements W.E. Ward, Waves Michelson Interferometer
WaMI Scientific Objectives • To identify the large scale waves present in the mesosphere and lower thermosphere in wind temperature and constituents. • To provide the large scale wind fields necessary for the interpretation of the gravity wave propagation and forcing characteristics. • Additional areas of investigation include data assimilation, MLT photochemistry, MLT dynamics, ground based/WAMI studies, coupling between atmospheric layers, energetics, and thermospheric/ionospheric dynamics. W.E. Ward, Waves Michelson Interferometer
WAMI Baseline Measurements • Measurement interval: 10 s • Spatial Resolution • 2 km vertical • 350 x 350 km horizontal • Day Altitude Range • 45-100 km (O2 1.27 mm) • 90-180 km (OI 0.558 mm) • Night Altitude Range • 80-100 km (O2 1.27 mm) • 90-120 km (OI 0.558 mm) • 80-100 km (OH 1.315 mm) W.E. Ward, Waves Michelson Interferometer
Emission Characteristics • The chemistry associated with the production of the O2(1D) nightglow emission is not yet completely understood but is thought to involve the recombination of atomic oxygen. • The OH nightglow emission is associated with the destruction of ozone by hydrogen and the greenline nightglow with recombination of atomic oxygen. • These three nightglow emissions are optically thin and provide insight into the chemistry, temperature and dynamics of the mesopause. • The greenline dayglow is caused by photoelectron impact excitiation, dissociative recombination of O2+, and reactions with N2. It is an optically thin emission. • The main source of daytime O2(1D) emission is the photodissociation of ozone. Additional sources include de-excitation of O2(1S) and a chemical source associated with the recombination of atomic oxygen. W.E. Ward, Waves Michelson Interferometer
Emission Rate Profiles O2 Infrared Atmospheric band radiances: a) Day from Thomas et a., 1984 b) Night from Howell et al., 1990 Oxygen green line intensities: a) day and b) night. From Gault et al., 1996 W.E. Ward, Waves Michelson Interferometer
WaMI Prototype Michelson • Phase steps deposited on mirror -- All exposures made simultaneously. • Eliminates intensity variation problem. • Achromatically field widened and thermally compensated 558-1300 nm. • Method verified by Doppler shift induced by spinning wheel. W.E. Ward, Waves Michelson Interferometer
Schematic of CCD Images Split Field Measurements With two steps all four phase images can be recovered and two emissions can be observed simultaneously. Summation of two images 180 degrees apart eliminates the interferometer effect and provides an irradiance image. STEP 1 STEP 2 W.E. Ward, Waves Michelson Interferometer
O2(1Δ)(0-0) Details • Two IR sets of emission lines were selected using the following criteria: • They are relatively well separated from the neighboring lines - optically isolated, • Line strengths differ by close to an order of magnitude - intensity variations and absorption characteristics vary with height so that the altitude range from 45 to 100 km can be observed under optically thin conditions, • Each emission set contains lines from two different branches within the band - ensures precise rotational temperature determinations. W.E. Ward, Waves Michelson Interferometer
Emission Line Wavelength in air (nm) Rel. Int. at 250 K dI/dT (K-1) O21 (0,0) strong RQ(9) 1264.060 0.019 -0.05% SR(3) 1264.277 0.016 -0.31 RR(9) 1264.386 0.023 -0.05 O2 1 (0,0) weak PQ(19) 1278.289 0.0045 +0.70 OP(11) 1278.408 0.0068 -0.12 PP(19) 1278.590 0.0041 +0.70 OH (8,5) P1(4) 1315.682 O(1S) 557.73 Emission lines W.E. Ward, Waves Michelson Interferometer
O2(1Δ) Radiance Variation with Height Weak Lines Strong Lines W.E. Ward, Waves Michelson Interferometer
Variation of Intensity vs T 10-3 Relative Intensity vs T (Weak lines) Relative Intensity vs T (Strong lines) W.E. Ward, Waves Michelson Interferometer
Absorption Effects Weak Lines Strong Lines W.E. Ward, Waves Michelson Interferometer
Spatial/Spectral Application Simulated image of O2 strong lines in the WAMI field of view Relative intensity as a function of incident angle seen through the etalons for the (a) strong and (b) weak O2 lines W.E. Ward, Waves Michelson Interferometer
Single measurement random error Temperature (K) 0 5 10 15 220 ) solid: wind m 200 k dashed: temp. ( 180 t Species Ht. km* Intens. (KR) S/N h 160 DAY g i 140 e H 120 t n 100 OI 557.7 nm e g 80 O1S 200 20 200 O2 strong n a O2 weak 60 T 150 55 450 100 90 600 O2(s) 80 640 1550 65 2700 3600 O2(w) 50 2300 2800 45 3000 3800 O1S 110 1.2 35 95 6.5 150 O2(s) 85 80 700 WAMI Signal/Noise 40 W.E. Ward, Waves Michelson Interferometer
Imaging Optics Michelson Interferometer Spectral Filter Imaging Detector Schematic of the Optical System Instead of the 4-point algorithm, each bin is considered to provide information on the line of sight radiance weighted by instrument parameters which include the filter transmission, F, the instrument responsivity, R, the visibility, U, and phase, , each of which have some dependence on the emission line. The contribution of each line to the observed irradiance can be determined using standard MLR routines. W.E. Ward, Waves Michelson Interferometer
Standard Analysis (WINDII) W.E. Ward, Waves Michelson Interferometer
Advanced Analysis • The set of J1l are simultaneously inverted for the intensity, temperature and density including the constraint of hydrostatic equilibrium. • The solution proceeds by assuming an initial profile and optimally estimating the deviations from that profile which best reproduce the observations. • In the expressions above f is the line strength, V is the Voigt profile, h the volume emission rate, n the number density and s the absorption cross section. • f, V and s all depend directly on the temperature, and n indirectly through the assumption of hydrostatic equilibrium. W.E. Ward, Waves Michelson Interferometer
Planned Orbit W.E. Ward, Waves Michelson Interferometer
Observation Tracks W.E. Ward, Waves Michelson Interferometer
Local Time Coverage W.E. Ward, Waves Michelson Interferometer
Summary • WaMI measures dynamical signatures (wind and temperature) and ozone and oxygen above the stratopause. • Work is under way to develop an inversion algorithm for the simultaneous inversion of density, temperature, and band VER for the O2(1Δ) observations. • The measurement approach ensures common volume observations for all observables thereby minimizing the influence of atmospheric variability on the measurements. • From these observations large scale dynamical signatures can be diagnosed and the energetics of the mesosphere and lower thermosphere investigated. W.E. Ward, Waves Michelson Interferometer