Download
1 / 15
150 likes | 312 Vues
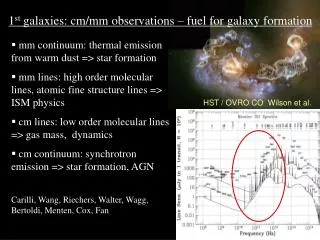
Near Infrared Emission Lines From Planetary Nebulae: Lines from H 2 and [Fe III]. L. Likkel 1 , H. Dinerstein 2 , D. Lester 2 , K. Bartig 1 , J. Bruch 1 1 University of Wisconsin – Eau Claire, 2 University of Texas at Austin. Observations.

E N D
Near Infrared Emission LinesFrom Planetary Nebulae:Lines from H2 and [Fe III] L. Likkel1, H. Dinerstein2, D. Lester2, K. Bartig1, J. Bruch11 University of Wisconsin – Eau Claire, 2 University of Texas at Austin
Observations • Near-infrared long-slit spectroscopic data were obtained with the 2.7m telescope at McDonald Observatory using a long-slit modular spectrometer, “CoolSpec” (Lester et al. 2000) with a NICMOS3 HgCdTe 256 256 pixel detector. • We used an entrance aperture corresponding to 1.8 90 on the sky, with spectral resolving power R = / ≈ 640. • The data were processed with standard IRAF procedures for flat-fielding, cosmic-ray removal, sky and thermal background subtraction, and response/flux calibration.
Figure 1: H I Br (2.167 m) usually dominates this part of the spectrum for PNs. M1-13 is a striking exception; the 2.121 m line dominates in this spectrum, obtained by placing our slit along the “waist” of this bipolar PN (Kastner et al 1996).
Background:Excitation of H2 in PNs • The two most commonly invoked mechanisms for producing near-infrared ro-vibrational H2 emission are shocks (thermal excitation) and UV fluorescence or radiative excitation (e.g. Shull & Beckwith 1982; Black & van Dishoeck 1987). • In principle, the intensity ratios of various H2 lines can be used to distinguish between these two mechanisms for particular objects (Dinerstein et al. 1988; Hora et al. 1999). • If the UV-illuminated gas is sufficiently dense, the line intensity ratios will be modified by collisions, causing some of popular line ratio diagnostics, e.g. F(2,1) S(1)/F(1,0) S(1), to mimic shock excitation (Sternberg & Dalgarno 1989).
Observed vs. Predicted H2 Line Ratios Predicted ratios are listed for several UV excitation models and two examples of shoc excitation
Results: H2 Emission We investigate the excitation mechanisms for H2 emission in these objects by comparing the observed H2 line ratios and upper limits with predictions from various models (Table). • BD+30 3639 is consistent with UV-excitation of dense gas, as is known from other observations of this PN (see poster by Dinerstein & Bowers, et al.). • The data for M 1-13 and IC 5117 suggest shock excitation, or radiative excitation of very dense gas (where the low-v levels are thermalized, see above). • The ratios for Vy 2-2 and SwSt 1 indicate a combination of mechanisms or moderately high gas density (but lower than for M 1-13 and IC 5117).
Background: 2 m region [FeIII] lines • The K-band hosts [Fe III] lines from the multiplet connecting the 3G and 3H terms. Since these transitions originate from highly excited levels, they are quite temperature-sensitive (which is unusual for infrared lines). • Each term has three fine-structure levels. Of four K-band transitions in this multiplet with relatively large (magnetic dipole) transition probabilities, three are in our wavelength region: 2.243 m, 2.218 m, 2.146 m Fe III energy-level diagram, from Fig. 6 of Bautista & Pradhan.
Figure 2: Several H2 and [Fe III] lines are seen, along with H I Br and He I. Note how [Fe III] 2.218 m blends with H2 2.222 m. Two weaker H2 lines (below our detection limit) also blend with iron: [Fe III] 2.242m with H2 2.248 m, and [Fe III] 2.145 m line with H2 2.154 m.
Figure 3. The [Fe III] line ratios (2.1457/2.2184m) & (2.2427)/(2.2184m)as functions of the electron density ne, as predicted by Keenan et al. (1992) and Bautista & Pradhan (1998), overplotted with measurements of several PNs.
Results: [Fe III] Ratios • The observed ratios of 2.2427/2.2184m for both SwSt 1 and Vy 2-2 are more consistent with the calculations of Keenan et al. (1992) than with those of Bautista & Pradhan (1998). • The observed ratios of 2.1457/2.2184m do not provide a conclusive test, due to large uncertainties in the line fluxes and in the value of ne. A published line ratio for Hubble 12 (Luhman & Rieke 1996) is more consistent with the calculations of Bautista and Pradhan (1998).
Iron Abundances in SwSt 1 and Vy 2-2 We estimated N(Fe++)/N(H+) from [Fe III] 2.218 m/H I Br , using the calculated level populations of Keenan et al. (1992). N.B.: Fe++/H+provides a lower limit to the total gas-phase Fe/H abundance. Assumptions for nebular physical conditions: For SwSt 1, we assumed Td = 10,500 K, log ne = 4.5, after De Marco et al. (2001). For Vy 2-2, we adopted Td = 10,000K and log ne = 5.
Fe Abundances & Depletions • We find gas phase abundances significantly lower than solar, with depletion factors of ≈ –1.7 dex.* Such depletions are milder than is typically found in the cold ISM, but are similar to those of the warm ISM (Savage & Sembach 1996). • Bearing in mind that Fe++/H+is a lower limit to Fe/H, since some of the iron may be in Fe+ or Fe+3, iron is actually less depleted than the above values. This suggests that some dust destruction has occurred, possibly due to shocks, resulting in the release of iron atoms back into the gas phase. • Sterling, Dinerstein, & Bowers (2003, in preparation) used UV resonance lines in a FUSE spectrum of SwSt 1 to calculate the abundance ratio Fe/S; from this independent method, they find that Fe is only mildly depleted (≈ – 0.7 dex) in the ionized gas. *[Fe/H] log10(Fe/H) – log10(Fe/H)solar
Conclusions • About of a third of the PNs in our survey display near-IR H2 emission, similar to the fraction found in previous surveys. • Rather than matching the extreme cases of pure fluorescence or fully thermal excitation, the observed intensity ratios of the H2 lines tend to have values consistent with collisional modification of radiatively-excited H2 or contributions from both mechanisms. We present the first information on H2 line ratios for two PNs, M1-13 and SwSt 1. • Several near-IR transitions of [Fe III] lie close to H2 lines, as previously pointed out by Depoy & Pogge (1994) for H II regions. While the [Fe III] lines are usually weak in PNs due to strong depletion into dust, in a few PNs the [Fe III] lines are strong enough to compromise popular H2 diagnostic ratios. • The 2.2427/2.2184 [Fe III] line ratio is consistent with the calculations of Keenan et al. The observed [Fe III] line strengths imply [Fe/H] depletions similar to (or weaker than) the warm ISM, possible evidence for dust destruction.
References • Bautista, M.A. & Pradhan, A.K. 1998, ApJ 492, 650 • Black, J.H. & van Dishoeck, E. F. 1987, ApJ 322, 412 • Depoy, D.L. & Pogge, R.W. 1994, ApJ 433, 725 • Dinerstein, H.L., Lester, D.F., Carr, J.S., & Harvey, P.M. 1988, ApJ, 327, L27 • Draine, B.T. & Bertoldi, F. 2000, in Molecular Hydrogen in Space, eds. F. Combes & G. Pineau des Foréts (Cambridge: Cambridge U. Press), 131 • Kastner, J.H., Weintraub, D.A., Gatley, I., Merrill, K.M., & Probst, R.G. 1996, ApJ, 462, 777 • Keenan, F.P., Berrington, K.A., Burke, P.G., Zeippen, C.J., Le Dourneuf, M. & Clegg, R.E. 1992, ApJ 410, 430 • Lester, D.F., Hill, G.J., Doppmann, G., & Froning, C.S. 2000, PASP 112, 384 • Luhman, K. L. & Rieke, G. H. 1996, ApJ 461, 298 • Hora, J.L., Latter, W.B., & Deutsch, L.K. 1999, ApJS 124, 195 • Savage, B.D. & Sembach, K.R. 1996, ARA&A, 34, 279 • Shull, J.M. & Beckwith, S. R. 1982, ARA&A, 20, 163 • Sternberg, A. & Dalgarno, A. 1989, ApJ, 338, 197
Acknowledgments We thank Bruce Draine for communicating results from his calculations of H2 excitation under conditions relevant to our PNs, and the observing support staff at McDonald Observatory for their tireless assistance. This project was supported by NSF grant AST 97-31156 to H.D. and by grants from the University of Wisconsin--Eau Claire to L.L.