Download
1 / 62
630 likes | 809 Vues
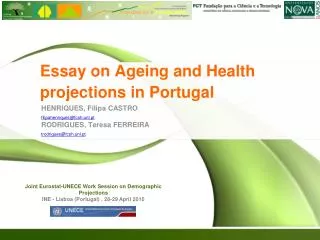
The challenges of ageing Demographic changes in Portugal. Paula Santana. CARE OF OLDER PEOPLE IN PORTUGAL TIME FOR GERIATRIC MEDICINE 26.November.2010. The challenges of ageing. Health Services utilisation. Health and Disease. Demographic changes ( ageing ). The challenges of ageing.

E N D
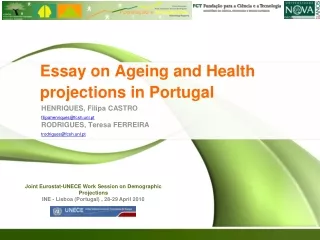
ThechallengesofageingDemographicchangesin Portugal Paula Santana CARE OF OLDER PEOPLE IN PORTUGAL TIME FOR GERIATRIC MEDICINE 26.November.2010
Thechallengesofageing HealthServicesutilisation HealthandDisease Demographicchanges (ageing)
Thechallengesofageing HealthServicesutilisation HealthandDisease Demographicchanges (ageing) Ageing is a privilege
Thechallengesofageing Utilização de Serviços de Saúde Saúde e doença Demographicchanges Evolution Isolation (lonelyoldpeople) Social Conditions (scholarity) Lifeexpectancywithoutincapcity
Population distribution >60 years, ECE region, Southern Europe and Portugal 1950 -2025 (%) Source: United Nations, Demographic Causes and Economic Consequences of Population Ageing. Economic Studies No. 3, Annex Table 1B pp. 35±38
Old-age dependency Ratio Europe 27 and Portugal 2008 -2060 Source: The 2009 Ageing Report. European Union
Old-age dependency Ratio Portugal, Belgium, Sweden and Europe 27 - 2008 -2060 Source: The 2009 Ageing Report. European Union
young and old population proportion evolution over total population (%), Portugal, 1960 - 2050 Sourcee: Elaborado a partir de INE
young and old population proportion evolution over total population (%), Portugal, 1960 - 2050 31,8% 29,2% Sourcee: Elaborado a partir de INE 13,1% 8% 2001: young= 15,6%; old= 17,1%
young and old population proportion evolution over total population (%), Portugal, 1960 - 2050 Variation: old + 0,23%/year young – 0,16%/year 31,8% 29,2% Sourcee: Elaborado a partir de INE 13,1% 8%
age ≥ 65 years population proportion, 2009 Source: INE (2009) 18,1% (1.838.327 people) (1,9% > 85 anos) 23,1% = Highest value in Alentejo Highest values = 30,3 Pinhal Interior Sul 27,4 Beira Interior Sul
age ≥ 65 years population proportion, 2009 Grande Lisboa = 365.399 (18,0%) Grande Porto= 202.229 (15,7%) Source: INE (2009) 18,1% (1.838.327 people) (1,9% > 85 anos) 23,1% = Highest value in Alentejo Highest values = 30,3 Pinhal Interior Sul 27,4 Beira Interior Sul
age ≥ 65 years population proportion, 2009 Grande Lisboa = 365.399 (18,0%) Lisboa = 116.022 (24,2%) Grande Porto= 202.229 (15,7%) Porto= 44.086 (20,9%) Source: INE (2009) 18,1% (1.838.327 people) (1,9% > 85 anos) 23,1% = Highest value in Alentejo Highest values = 40,8 Idanha-a-Nova 40,5 Penamacor 38,9 Alcoutim
Older population concentration (longevity) 2009 Longevity(>74/>64) Source: INE (2009) Continent = 46,9% (highest value in Alentejo = 51% Highest values = 58,6 Pinhal Interior Sul 56,4 Beira Interior Sul
Older population concentration (longevity) 2009 Longevity(>74/>64) Sourcee: Elaborado a partir das estimativas da população residente a 31/5/2010. INE (2009) Continent = 46,9% (highest value in Alentejo = 51% Highest values = 64,6 Idanha-a-Nova 63,1 Mação
Life Expectancy at 65 years (2007-2009) • Variations NUTS II: • Lisbon (18,51 years)thebest • Alentejo (17,95 anos)theworst • Difference: 0,56 years • Variations NUTS III: • Entre Douro e Vouga (19,09 anos) thebest • Baixo Alentejo (17,05 anos) theworst • Difference: 2,04 years Source: INE (2009)
Old people living alone, 2001 Total = 310.860 (17,4%) (2001) 241.608 Women 69.252 Men Source: Censo, 2001 INE Legend: Old men living alone (%)
Old people living alone, 2001 Men Highest values = 6.036 Lisboa (12,2%) 1.800 Porto (9,7%) 138Alcoutim (19,1%) 239 Mértola (18,8%) Sourcee: Elaborado a partir do Censo, 2001 INE Legend: Old men living alone (%)
Old people living alone, 2001 Women Highest values= 27.734 Lisboa (33,1%) 9.269 Porto (28,7%) 187 Penedono (35,2%M) Legend: Old men living alone (%) Legend: Old women living alone (%)
1991 – 2006 variation (1991=100) Life expectancy at birth and at 65 years Growth of LE65 years is almost 3 times bigger than LF at birth
Life Expectancye Esperança de Vida sem nenhum tipo de Incapacidade – both genders, 2005/06 Source: INE (óbitos e estimativas de população residente, em 2005 e 2006) e do INS 2005/2006
Life Expectancy and Life Expectancy without any kind of disability – both genders, 2005/06 Source: INE (óbitos e estimativas de população residente, em 2005 e 2006) e do INS 2005/2006
LifeExpectancywithoutdisabilityby age andgender 2006 Sourcee: INE (óbitos e estimativas de população residente, em 2005 e 2006) e do INS 2005/2006
Scholarity, 2001 Source: INE, Censos 2001
Scholarity (prevision), 2026 Source: INE, Projecções Demográficas
Scholarity (prevision), 2026 Source: INE, Projecções Demográficas
Immigrantslivingin Portugal, 1991and 2001 Source: INE, Censos 1991 e 2001
Immigrantslivingin Portugal, 1991 and 2001 Source: INE, Censos 1991 e 2001
Ageing | Impacts assessment Utilização de Serviços de Saúde Healthanddisease Envelhecimento
% of individuals with temporary incapacity* Source: INSA/INE – 4º INS (2005-2006) * In this two weeks, how many days you left doing something that usually you do due to a desiase, accident, violance or other motive related with heath?
% of individuals with temporary incapacity* and days (average), 2005/06 Source: INSA/INE – 4º INS (2005-2006) * In this two weeks, how many days you left doing something that usually you do due to a desiase, accident, violance or other motive related with heath?
Evolution of the % of the population with ≥65 years reporting temporary incapacity 1996, 1999 e 2006 Source: Santana (2000) e INSA/INE – 3º e 4º INS
Individuals (%)stayinginbedanddays (average), 1999 and 2006 65 – 74 years Days People (%) Peopleinbed (%) Numberofdays Source: INSA/INE – 3º e 4º INS
Individuals (%)stayinginbedanddays (average), 1999 and 2006 > 74 years 65 – 74 years People (%) Days Days People (%) Peopleinbed (%) Number of days Numberofdays People in bed (%) Source: INSA/INE – 3º e 4º INS
Activities performed by individuals with more than 65 years 1999 e 2006 65 – 74 years Walk in a flat place Dress and Undress Lie dowm and get out from bed Sourcee: INSA/INE – 3º e 4º INS
Activities performed by individuals with more than 65 years 1999 e 2006 65 – 74 years > 74 years Walk in a flat place Dress and Undress Lie dowm and get out from bed Walk in a flat place Lie dowm and get out from bed Dress and Undress Source: INSA/INE – 3º e 4º INS
IndividualswithChronicleDiseases, 1999 and 2006 Diabetes Source: INSA/INE – 3º e 4º INS
IndividualswithChronicleDiseases, 1999 and 2006 Diabetes Asthma Source: INSA/INE – 3º e 4º INS
IndividualswithChronicleDiseases, 1999 and 2006 Diabetes Asthma Hipertension Source: INSA/INE – 3º e 4º INS
Otherriskfactors, 2006 Overweight (IMC >27) Source: INSA/INE – 3º e 4º INS
Otherriskfactors, 2006 Low-weight (IMC <18,5) Overweight (IMC >27) Source: INSA/INE – 3º e 4º INS Age > 86 Years: 6,8% H 7,8% M
Otherriskfactors, 2006 Variation (99/06) Low-weight (IMC <18,5) Overweight (IMC >27) Low-weight (IMC <18,5) Source: INSA/INE – 3º e 4º INS Age > 86 Years: 6,8% H 7,8% M
Otherriskfactors, 2006 Tobacco Consumtion Phisical Inactivity (walk) Source: INSA/INE – 3º e 4º INS
(“very good” and “good”) evaluation of Health Status 1999e2006 Source: INSA/INE – 4º INS (2005-2006) Sourcee: INSA/INE – 3º e 4º INS
Ageing|Impactsassessment HealthServicesutilisation Saúde e doença Envelhecimento
Medicines consumption of individuals =>65 years Source: INSA/INE – 4º INS * Tomou medicamentos receitados (incluindo pílulas contraceptivas ou outras hormonas, pomadas, cremes, injecções, vacinas, etc.) nestas duas semanas?
Outpatientvisits (%) Evolution1996, 1999 and 2006 ofpopulation65-74 & > 74 years Source: Santana (2000) e INSA/INE – 3º e 4º INS Sourcee: Elaborado a partir de Santana (2000) e INSA/INE – 3º e 4º INS